Azure, Microsoft Graph and Endpoint Analytics for better Windows 10 user experience
The change to how we work
Over the past few months, the way we work has changed significantly. We need to collaborate more frequently, work from anywhere and anytime and be more productive given the challenging times we are living. This has driven companies to rely more on technology to empower their users to be more productive working from anywhere and on any device. With this fast-paced change, companies need understand how the technology they are using is contributing to increased productivity and how it can be further improved.
Microsoft 365 “The productivity cloud”
Last year Microsoft announced Productivity Score which is a service that gives you insights that transform how work gets done. It will provide you visibility into how your users work, and how they use technology to be more productive, collaborate more and work from anywhere. You get a productivity score for your organization where you can compare it with other organizations to understand where you want to improve and where you are doing better than others. You can see a quick overview of this service in the video below
Microsoft Endpoint Analytics
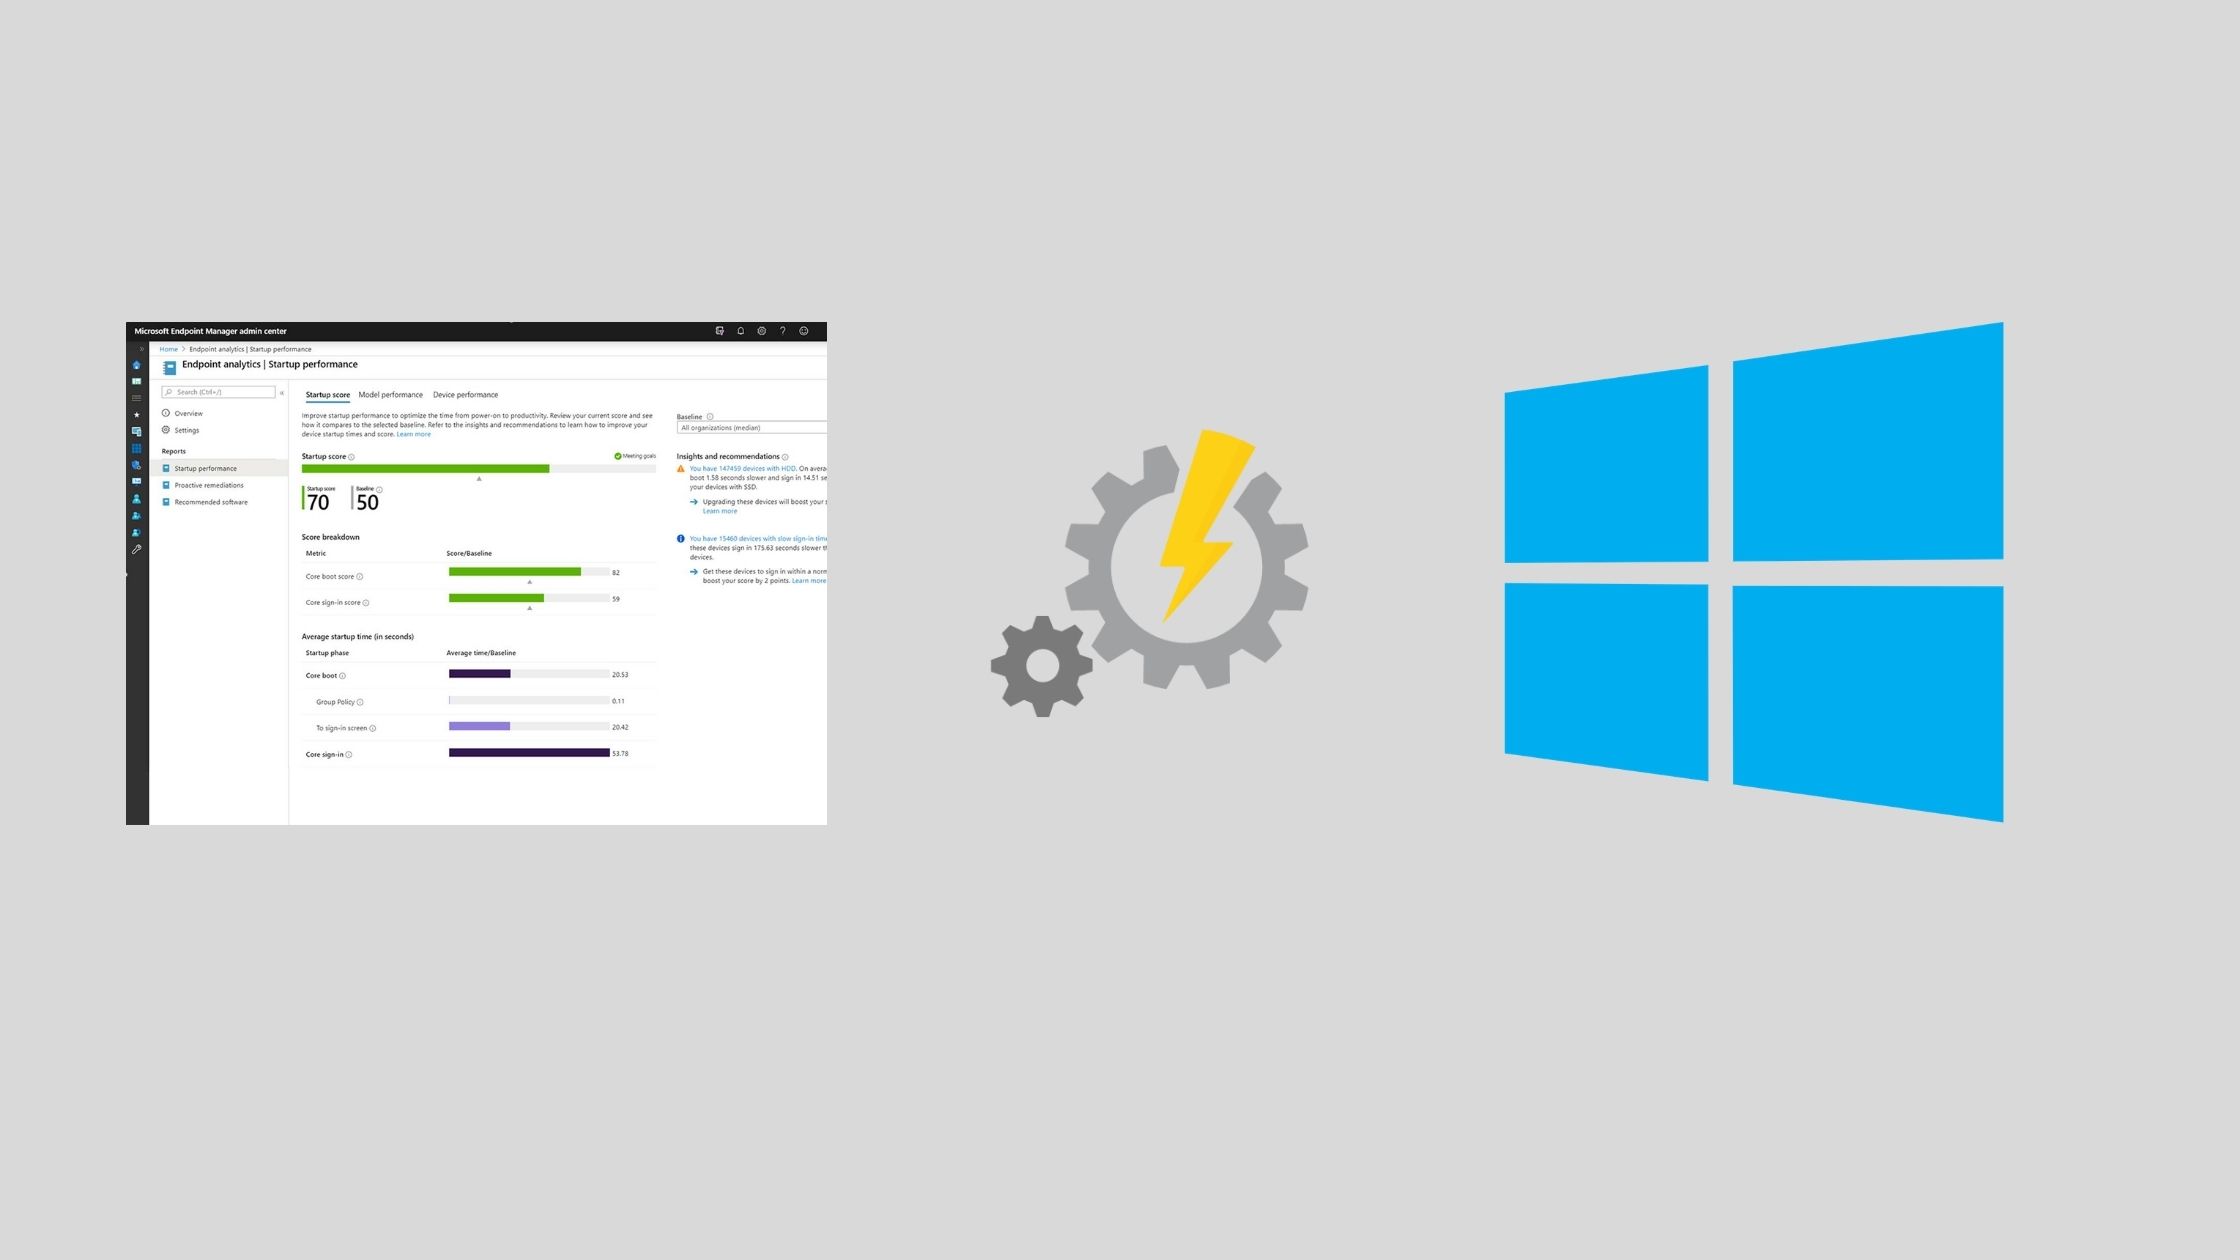
Being part of the Microsoft Productivity Score, Endpoint Analytics provide insights to help you understand and optimize your devices’ reboot and sign-in times, so your users are not late to that online meeting. It also helps you proactively remediate common support issues before your users become aware of them and to help reduce the number of calls your helpdesk gets. Endpoint Analytics also enables you to track the progress of enabling your devices to get corporate configuration data from the cloud, making it easier for employees to work from home.
With Endpoint Analytics now in preview it can help you with insights on:
- Legacy hardware
- Software configurations that aren’t optimized for the end-user experience
- Issues caused by configuration changes and updates
What are we going to build?
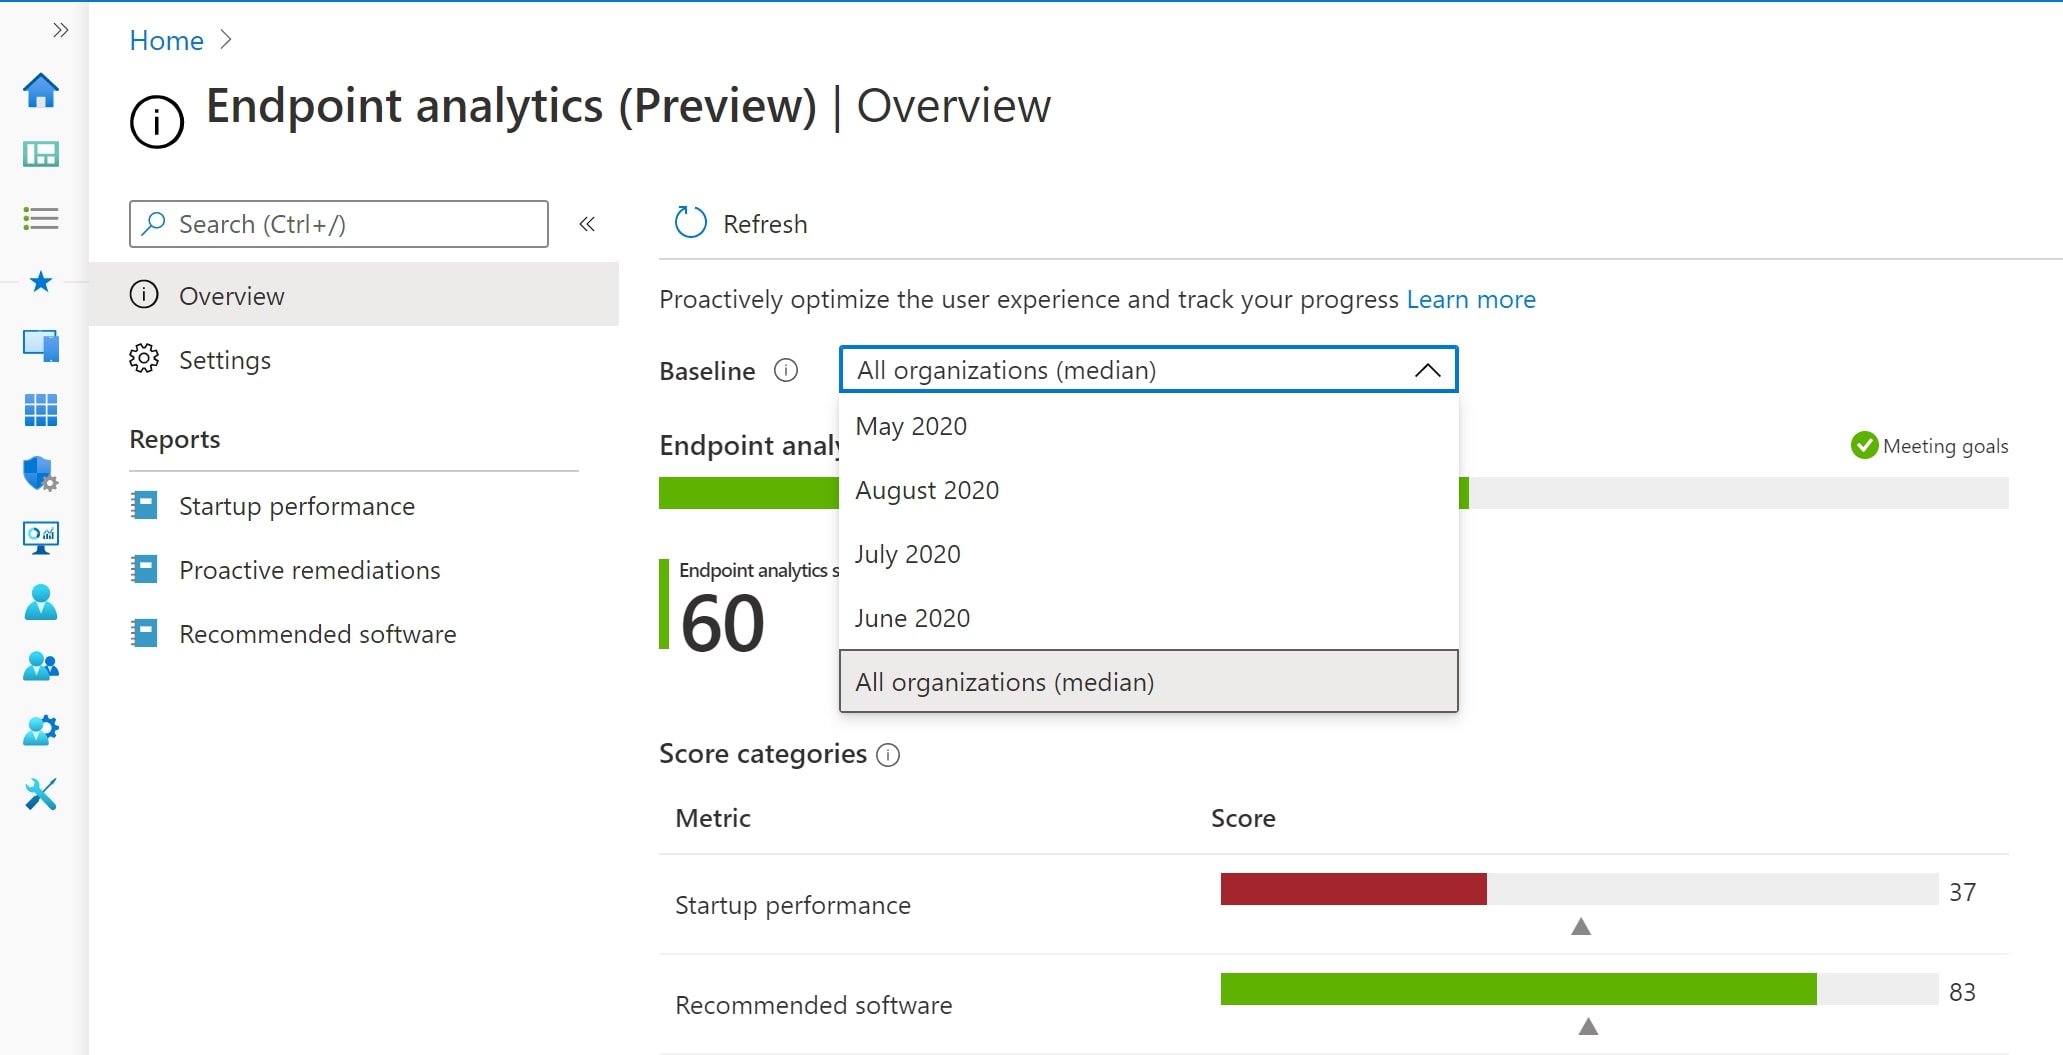
Endpoint Analytics has a built-in baseline for All organizations (median), which allows you to compare your scores to a typical enterprise and also allows you to create your own baselines to measure the impact of any changes introduced to your environment . What we are going to do is leverage the Microsoft Graph and Azure automation to schedule the creation of a monthly baseline of your environment so you can have a monthly/yearly/quarterly view on the experience your users are having on their Windows 10 devices and recommendations on what you can do to improve your overall score.
Our goal:
Preparation
Microsoft Graph permissions
The first thing we need to do is to create an Azure AD app registration to be able to authenticate and query the Microsoft Graph. Detailed steps can be found here
After creating our App, we need to assign the appropriate graph permissions to query the Microsoft graph to list, delete and create baselines. A reference of all graph endpoints can be found here. For us we will need to assign the following permission:
- DeviceManagementManagedDevices.ReadWrite.All
Next, we need to generate an App Secret so we can authenticate our script to the Microsoft Graph. Make sure to copy the secret as this is the only chance you will have to see it :)
Now we have all pre-requisites ready to be able to connect to the Microsoft Graph and interact with Endpoint Analytics.
The PowerShell script
We will use a PowerShell script to query endpoint analytics and create new baselines, you can find the script in my GitHub repository
##Variables to Edit ##
  $MonthstoKeepBaselines=5
  $tenant = ""
  #End Editing#
  $authority = "https://login.windows.net/$tenant"
  $AppId = Get-AutomationVariable -Name 'AppId'
  $AppSecret = Get-AutomationVariable -Name 'AppSecret'
  $Resource = "deviceManagement/userExperienceAnalyticsBaselines"
  $graphApiVersion = "Beta"
  $uri = "https://graph.microsoft.com/$graphApiVersion/$($resource)?"+'$orderby'+"=createdDateTime%20desc"
  $currentMonth= get-date -Format Y

  Update-MSGraphEnvironment -AppId $AppId -Quiet
  Update-MSGraphEnvironment -AuthUrl $authority -Quiet
  Connect-MSGraph -ClientSecret $AppSecret -Quiet
  $baselines=Invoke-MSGraphRequest -HttpMethod GET -Url $uri
  $numberOfBaselines=$baselines.value.Count

  ##Baselines cleanup##
  $monthstodelete=((get-date).AddMonths(-$MonthstoKeepBaselines)).ToString("yyyy-MM-dd")
  $uri = "https://graph.microsoft.com/$graphApiVersion/$($resource)?"+'$filter'+"=createdDateTime%20lt%20$monthstodelete"
  $baselinesToCleanUp=Invoke-MSGraphRequest -HttpMethod GET -Url $uri
  $baselinesToCleanUp.value | foreach-object{
      $baselineID = $_.id
      $deleteUri = "https://graph.microsoft.com/$graphApiVersion/$($resource)/$baselineID"
      Invoke-MSGraphRequest -HttpMethod DELETE -Url $deleteUri | Out-Null
  }

  ##Check if the 100 limit is reached then delete oldest year baselines##
  if($numberOfBaselines -ge 88){
          $baselines.value | select-object -last 12 | foreach-object{
          $baselineID = $_.id
          $deleteUri = "https://graph.microsoft.com/$graphApiVersion/$($resource)/$baselineID"
          Invoke-MSGraphRequest -HttpMethod DELETE -Url $deleteUri | Out-Null
      }
  }
  else {
  $newBaseline=@"
  {
      "displayName":"$($currentMonth)"
  }
  "@
##Create new Baseline##
  $newBaselineURL= "https://graph.microsoft.com/$graphApiVersion/$($resource)"
  Invoke-MSGraphRequest -HttpMethod POST -Url $newBaselineURL -Content $newBaseline | out-null
  }
The scripts does the following:
- It will connect to the Microsoft Graph using the Azure AD app we created
- You need to specify the number of months to keep baselines before cleaning them up (Example: Keep the last 6 months of baselines)
- You need to specify the tenant variable as well
- It will create new baseline for the current month in Endpoint Analytics
Using Azure automation to run the script on a monthly basis
We will need to create a new Azure Automation account to schedule the PowerShell script to run monthly
Next we need to import the Microsoft.Graph.Intune PowerShell module

Now we need to create a new PowerShell runbook and import our code and provide our Azure App ID and App secret securely to our script

Finally, we create a monthly schedule for our automation script
Recap
Endpoint Analytics is a very powerful service that will help you to deliver pinpoint bottlenecks, improve your users’ productivity and overall provide great experiences to your them. Adding the Microsoft Graph to the mix, the sky is the limit for what you can get out of this service. Another idea is to monitor the Endpoint Manager audit logs for any Windows 10 configuration change and automatically create a baseline to assess if this change will positively or negatively impact your users’ experience. A sample script can be found in my GitHub repository as well (different permissions will need to be assigned to the Azure AD application for this to work)
Share on:
My name is
Seif Bassem
You May Also Like

CI/CD evaluation of Large Language Models using OpenEvals
Reliability of Large Language Models: Why continuous Evaluation …
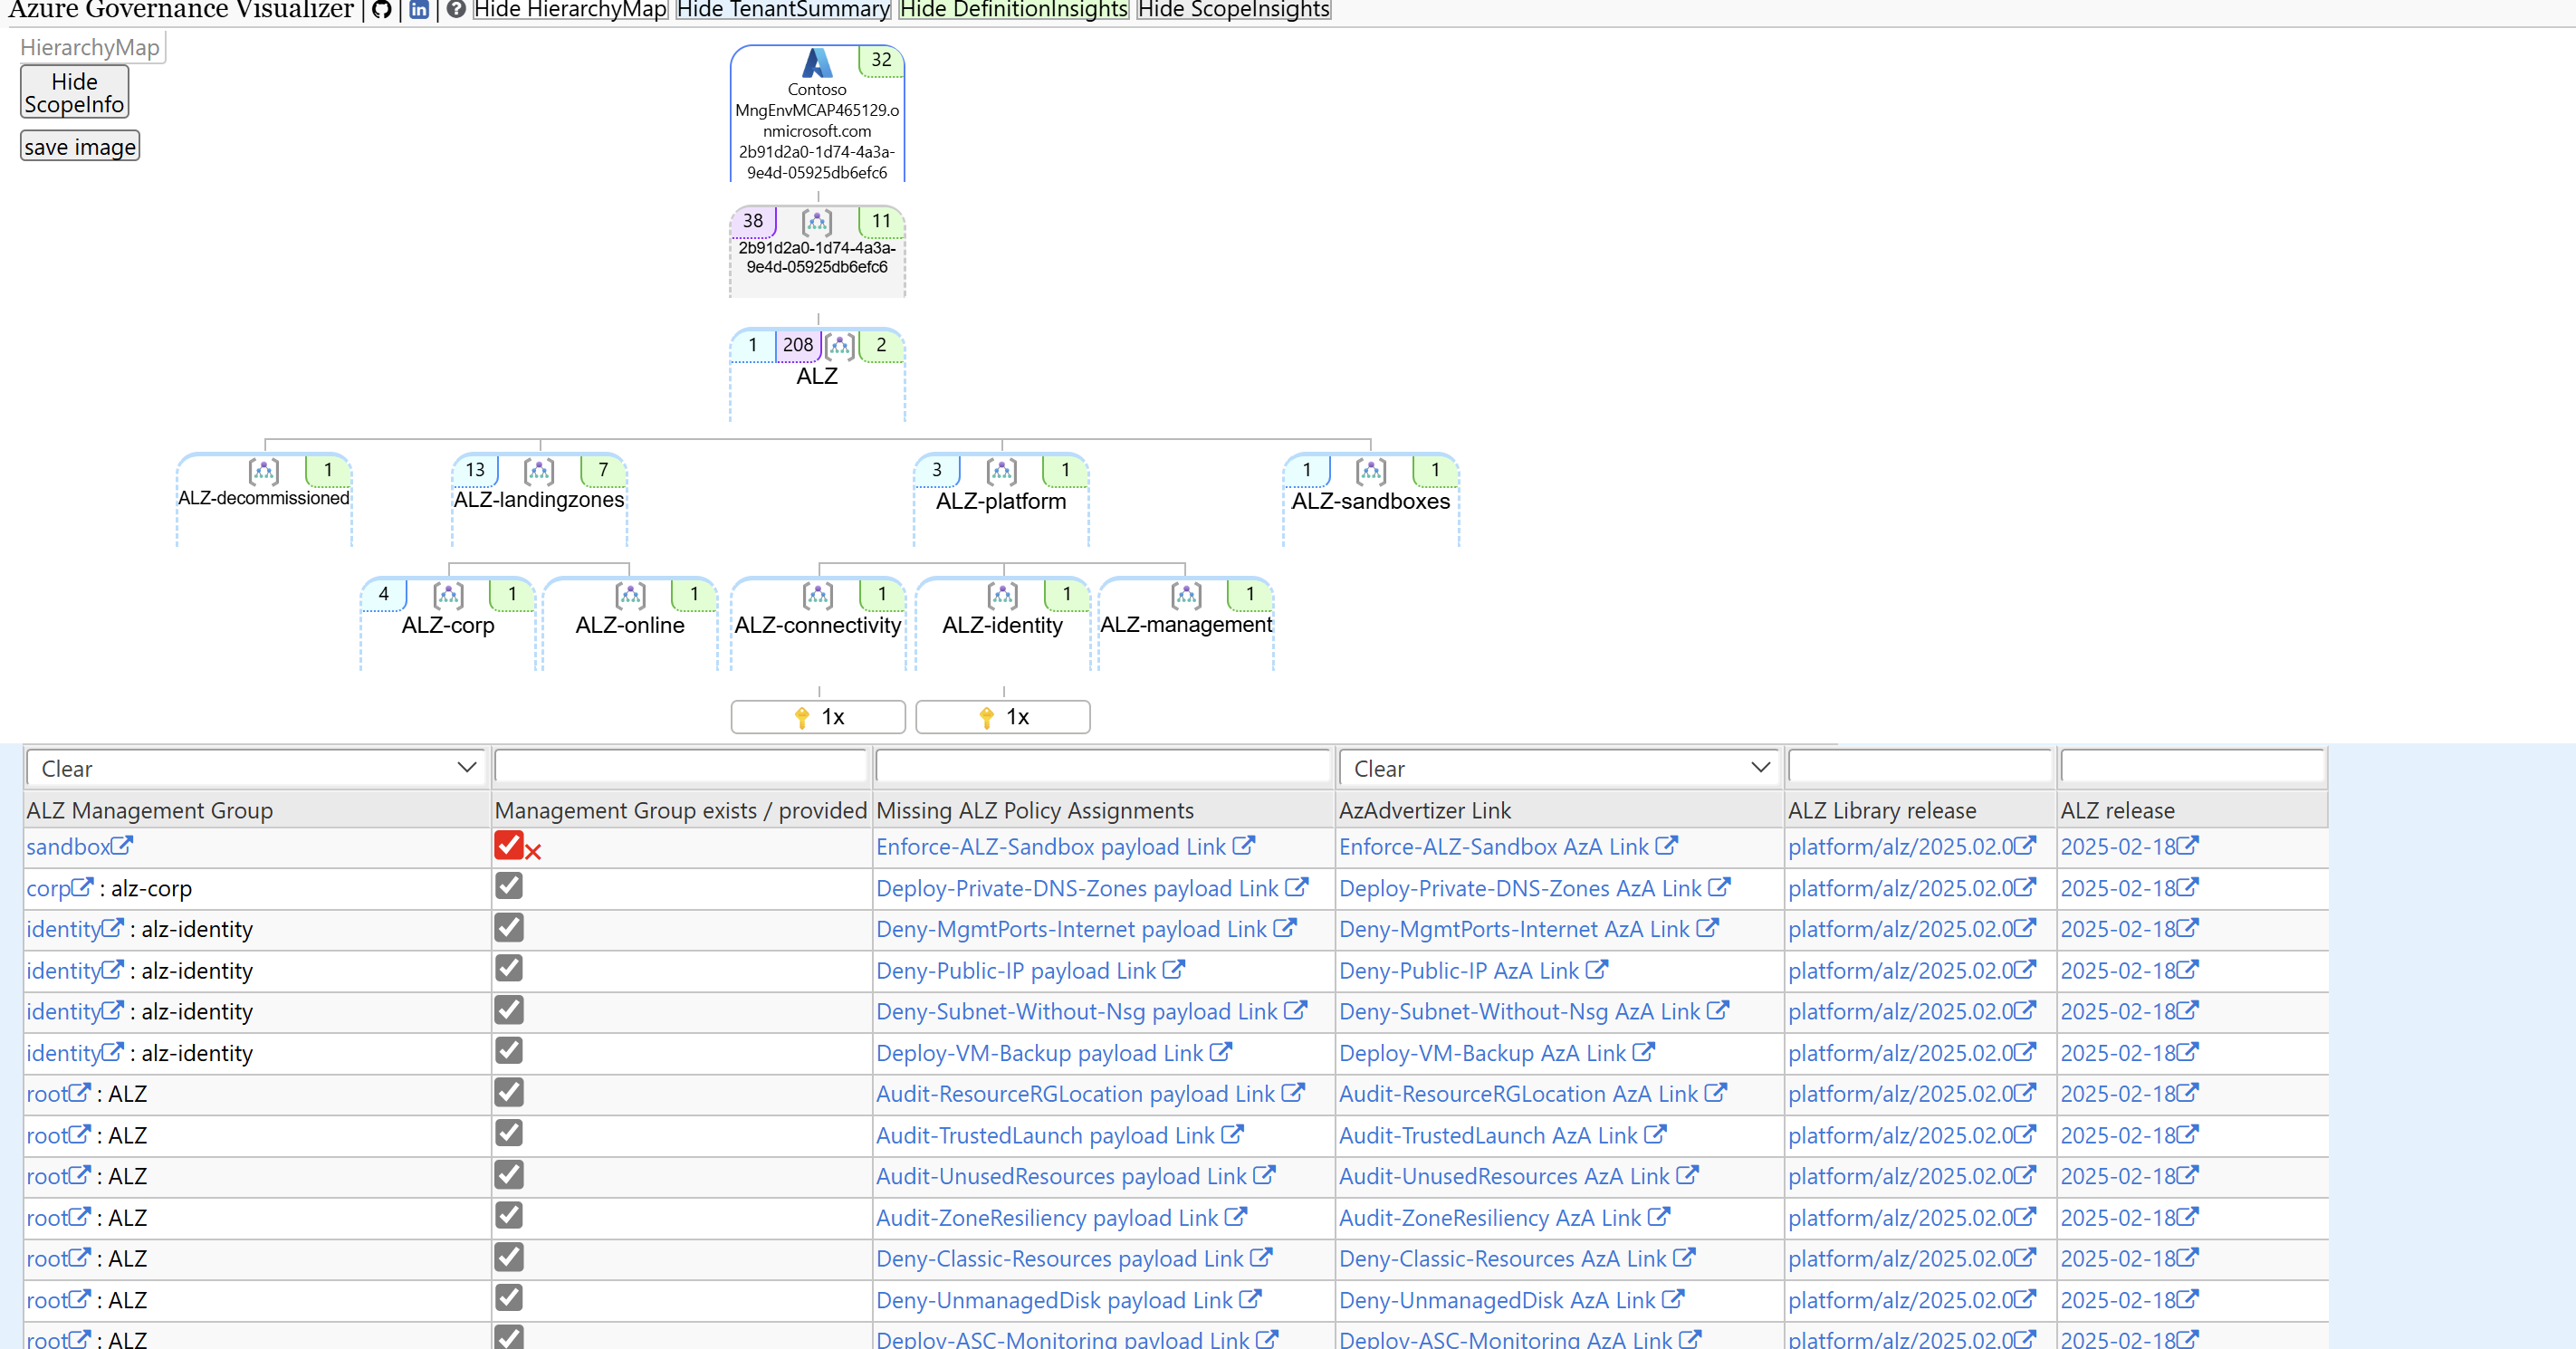
Azure Landing Zones - Policy assignments checker
One of the main challenges of maintaining your Azure Landing Zone …
Simplifying private deployment of Azure AI services using AVM
I recently worked with a couple of customers on designing an …