The ultimate guide to the new Azure Monitor Agent
When looking at monitoring virtual machines using Azure Monitor , you have to look at your monitoring needs which vary by operating system , metrics , logs , insights , custom logs , solutions on log analytics , and much more . All of those decisions will most probably require you to deploy more than one agent on your machines to be able to have this kind of visibility , which is streamlined to some extent by Azure in-terms of deployment and management but it’s still too much agents on the virtual machines and you would face some tradeoffs in-terms of centralized vs. decentralized data collection configuration. If we look on the logs level , you have the log collection configuration centralized on the log analytics level so any virtual machine reporting to this workspace will send this type of logs , there was no granular way to specify different configuration for different machines.
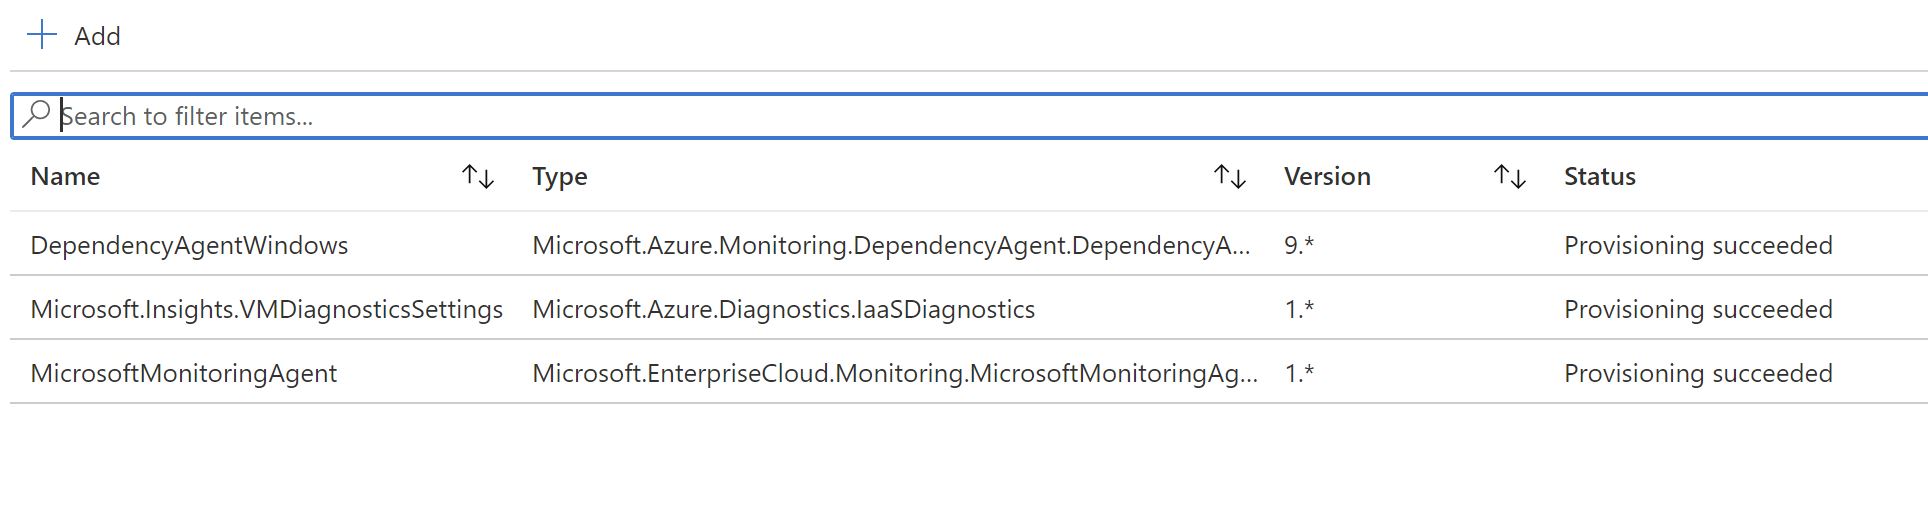
Current Agents
- Log analytics agent
- Azure diagnostics extension
- Dependency agent
- Telegraph agent (linux only)
For a detailed comparison of all agents , check this link
The Azure Monitor Agent
It was recently announced that now we have one agent which is planned to replace all the previous ones and a new concept call “Data Collection Rules(DCR)” which promises to provide very interesting capabilities like : multi-homing ,abstraction of data collection configuration from the log analytics workspace ,different authentication model ,windows event filtering and more.
⚠️ This new agent is currently not on 100% parity with the other agents , more capabilities are added every month . Keep an eye on this article for frequent updates and current limitations
The new DCR concept is all about ,creating different DCRs based on your requirements and assigning them to different machines which is very useful into defining more granular monitoring requirements based on the operating system and data collection requirements . Once you define your DCRs , you would create an association with the VMs and that’s it.

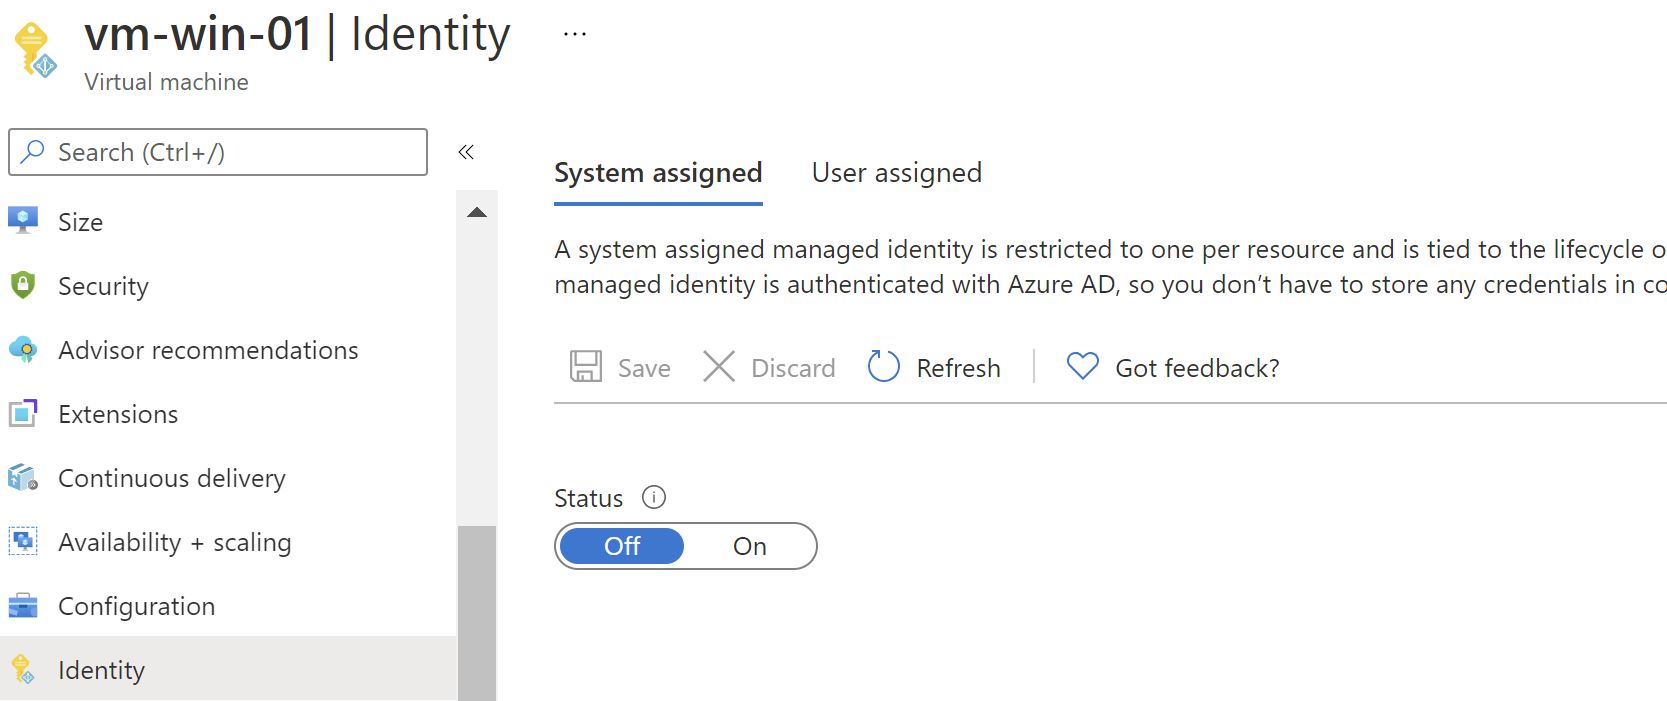
The new agent also has a new authentication model , previously when using log analytics , you would have to provide a workspace key and ID to the agent installation. This is now changed to using a system-assigned managed identity on the virtual machine which further simplifies the installation process and saves us from the operation hassle of managing the keys in scenarios of key rotation for example.
Azure Monitor Agent installtion
The agent is installed as a VM extension ,and there are multiple ways to install it (Portal,CLI,Powershell,ARM,Policy,..etc) , in this post i will cover the portal and policy deployments:
1.Portal deployment
This is the most straightforward method to install and enable the new agent and DCR as it automatically enables the managed identity on the VM ,installs the extension, creates and configures the DCR and the DCR association.
Let’s take an already existing VM that has all the other agents deployed and see the full experience.
We don’t have managed identity enabled on this VM
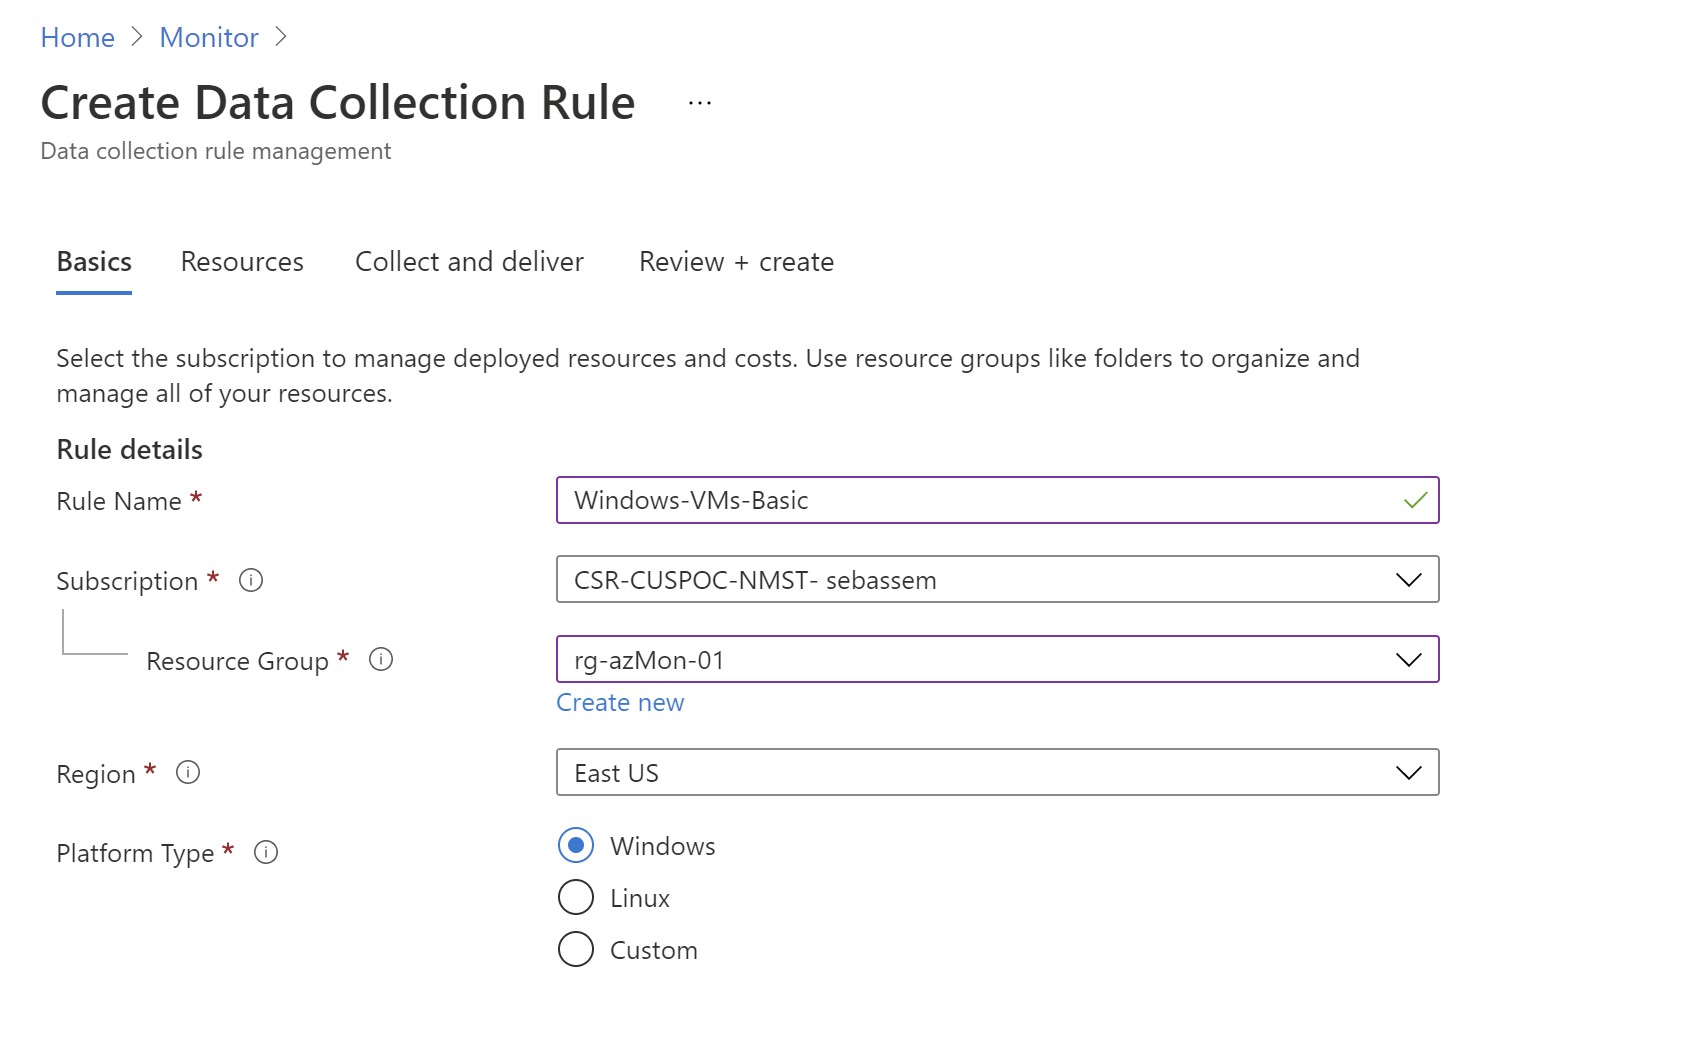
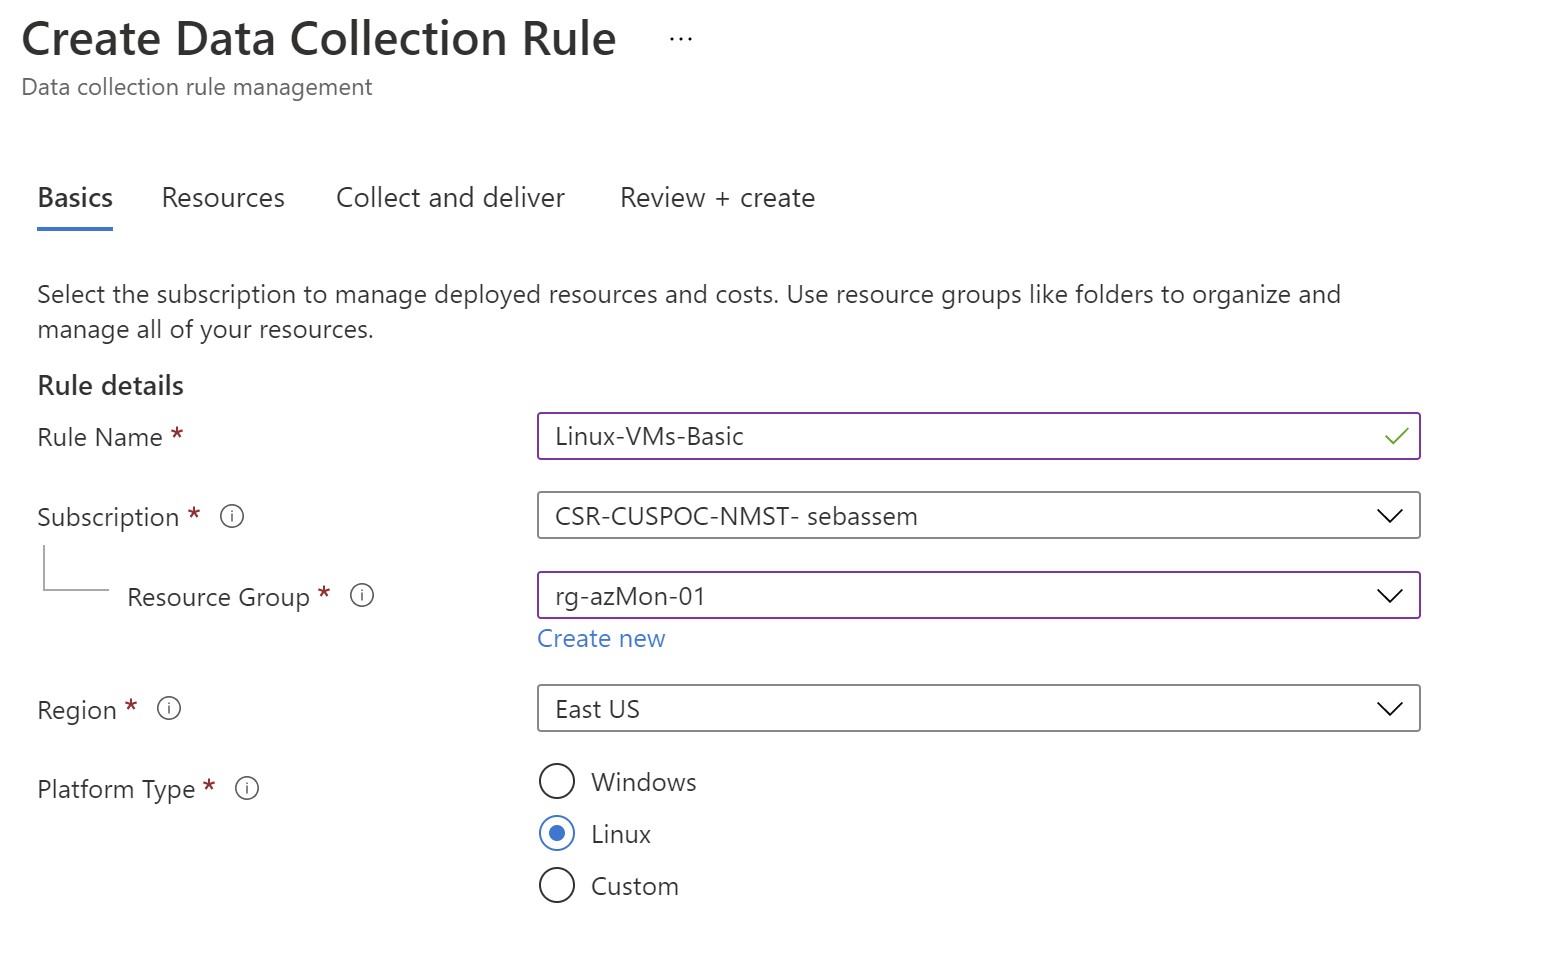
First ,we go to Azure Monitor and select the new Data Collection rules pane
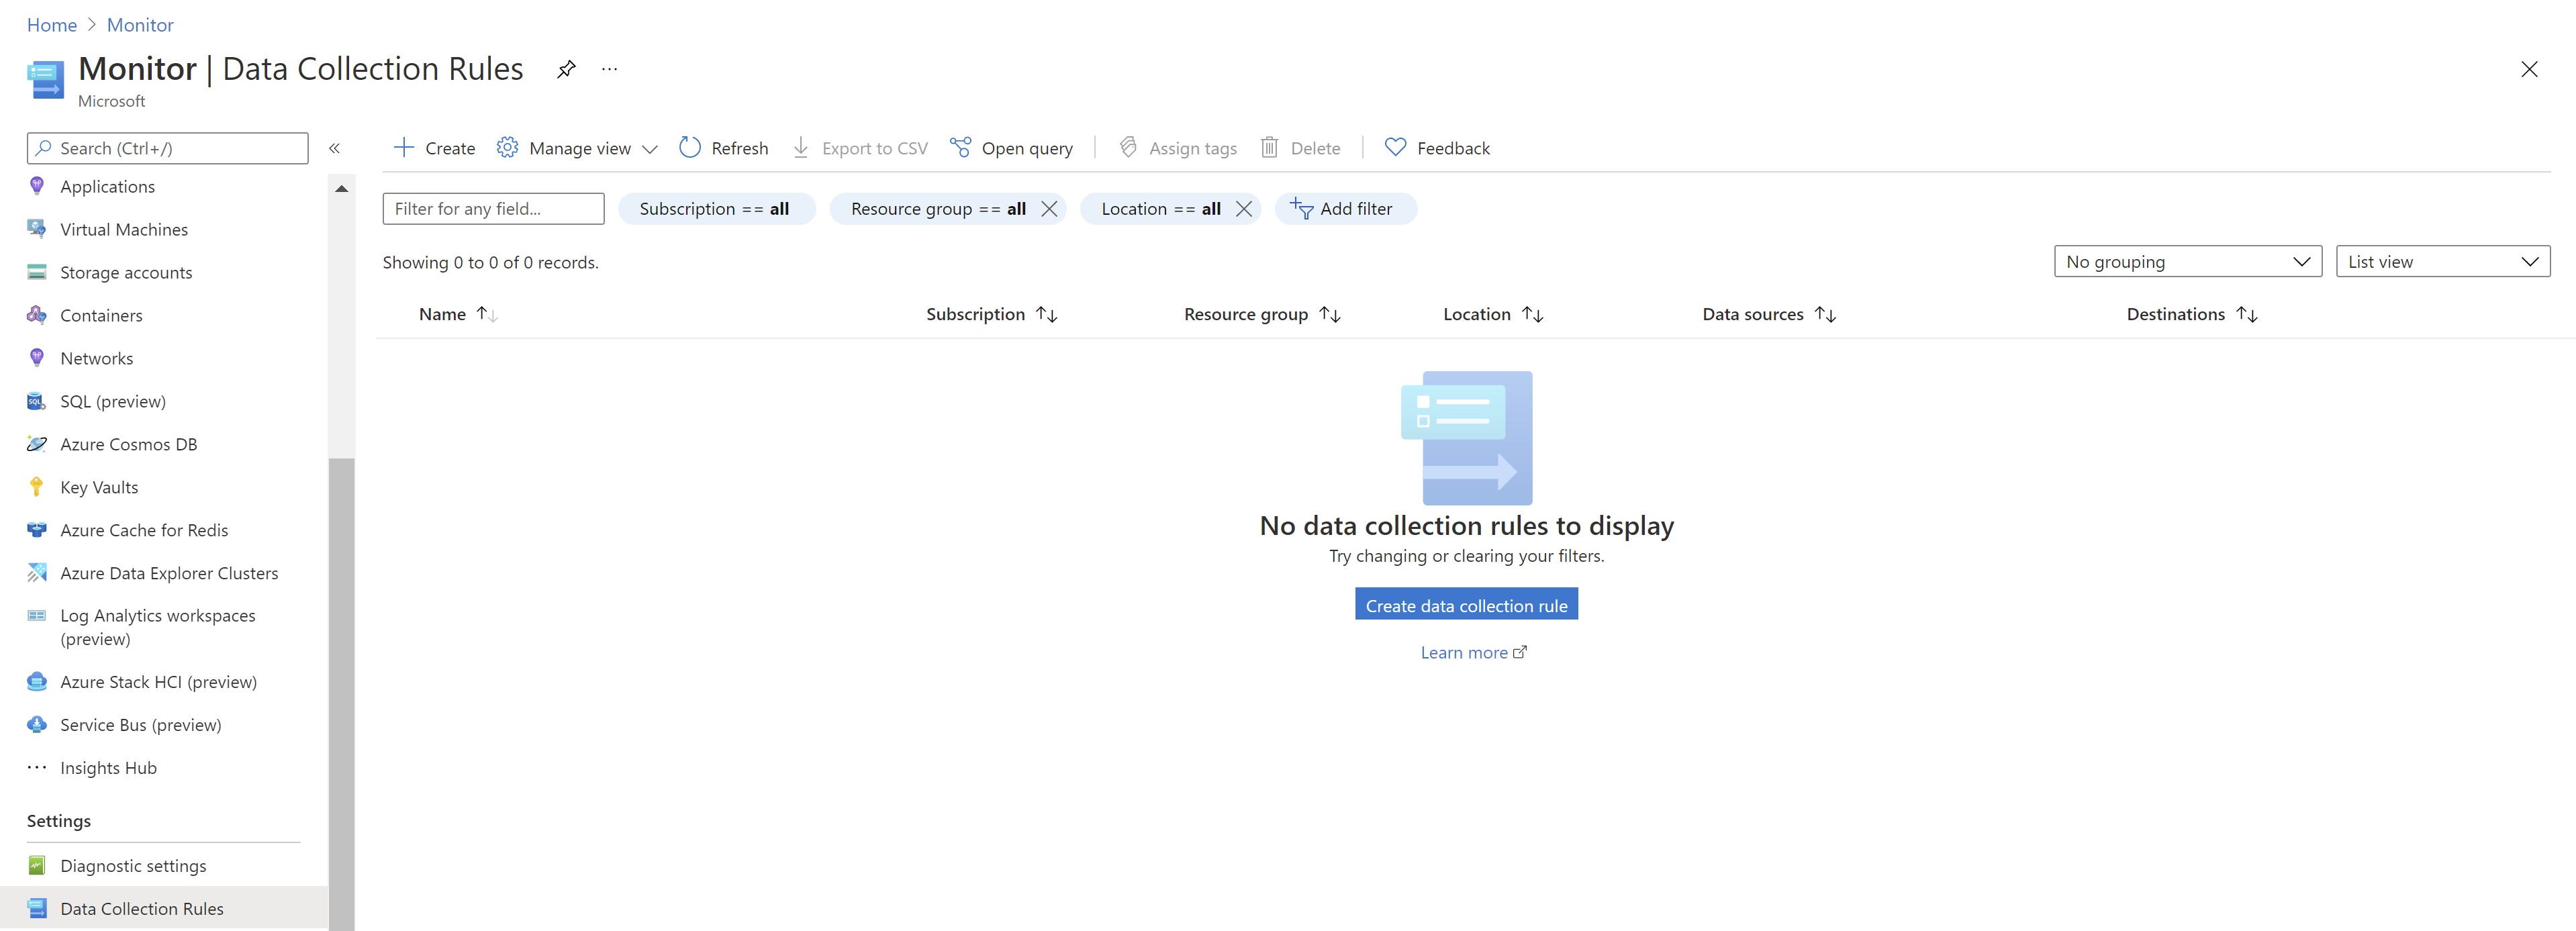
Let’s create a new one .While we have to select a resource group for the DCR ,the virtual machines can reside in any other resource group . The only thing to note here is if you are going to send data to log analytics , you must have the DCR in the same region where the log analytics workspace is located. You can either choose windows or linux but you can also use custom if you want to have one DCR for both.
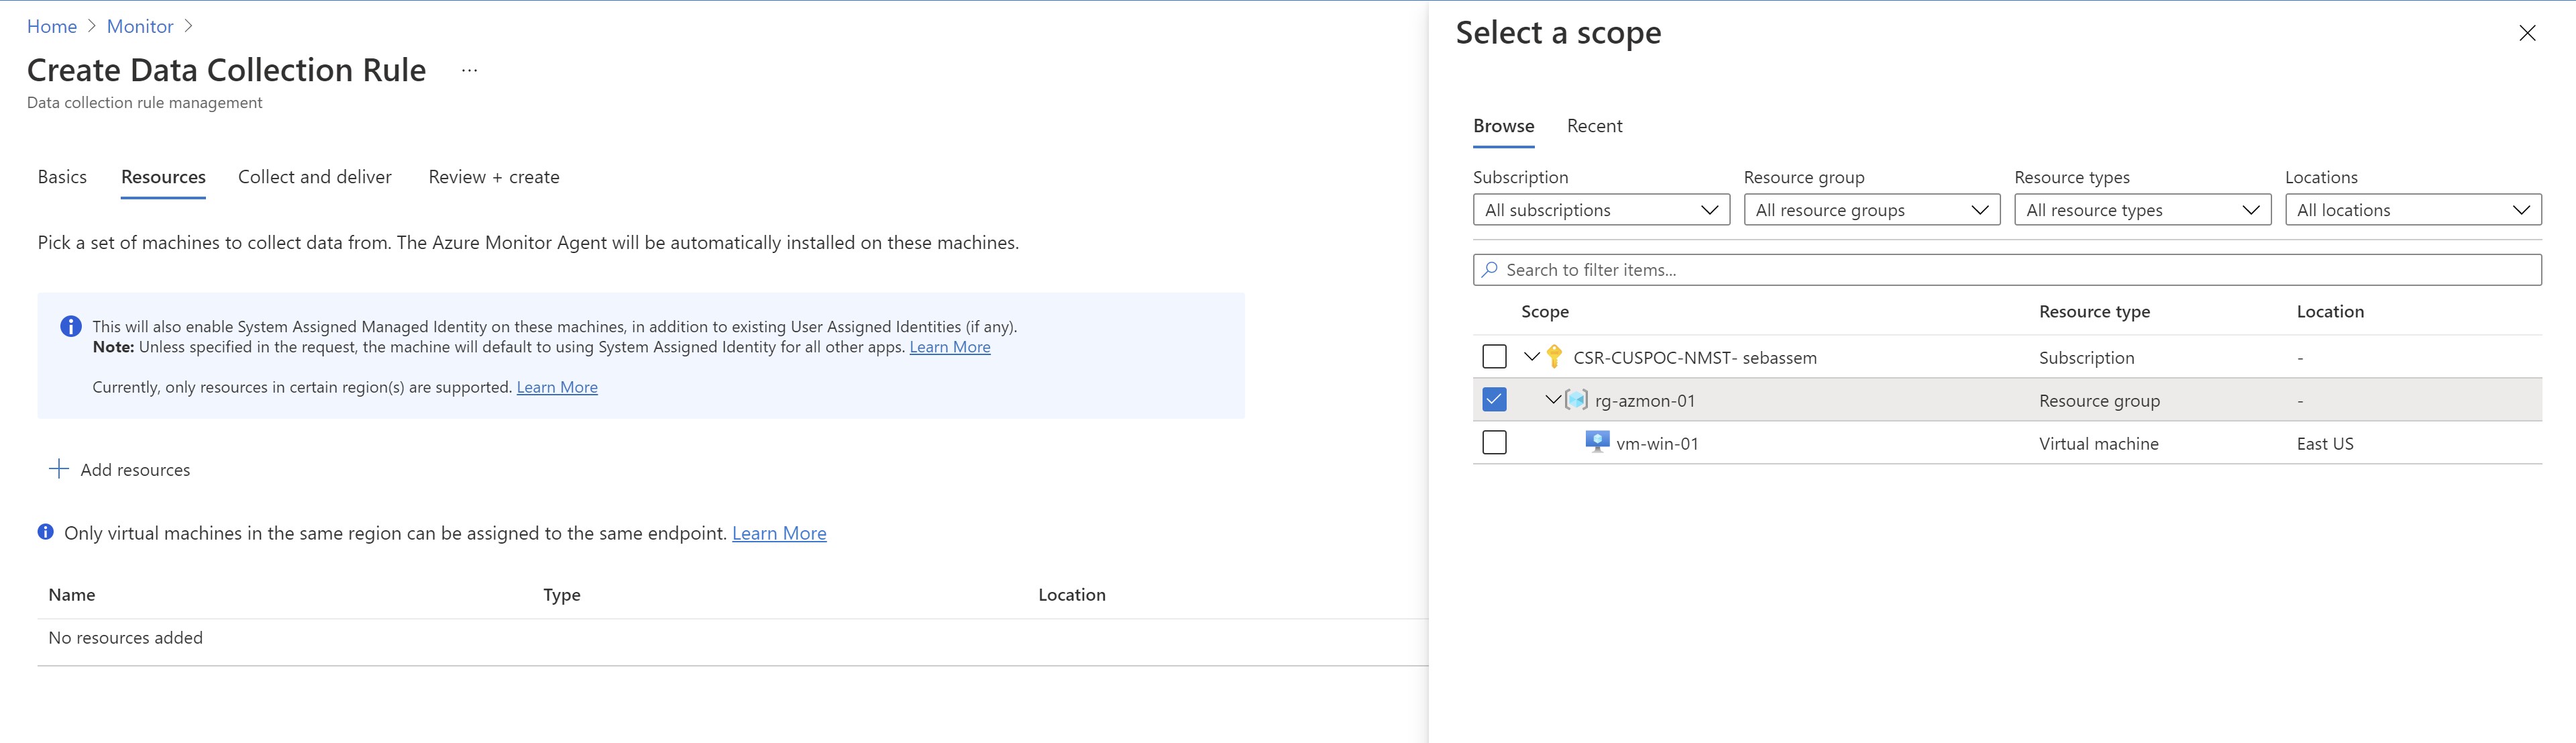
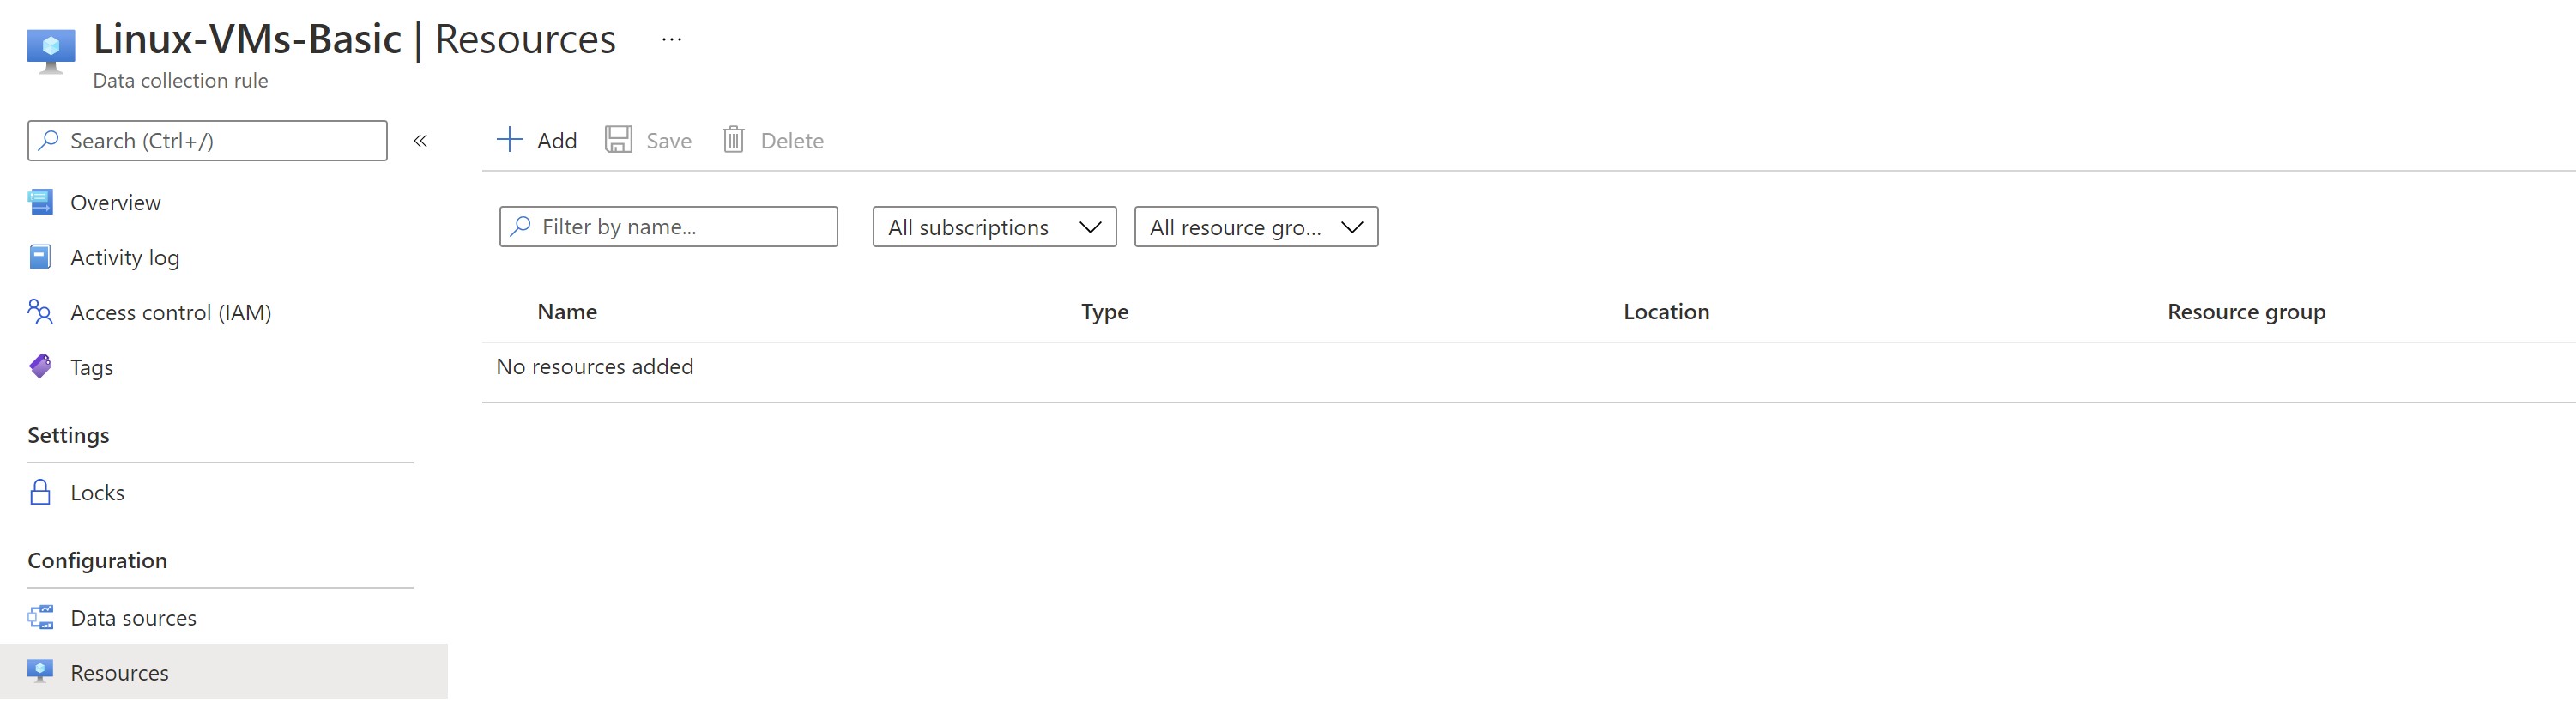
Next comes the interesting part , first we need to select the resources that will be associated with this DCR. Note that if you select a subscription or resource group scope ,only resource available at that time will be added ; newer VMs created later under this scope won’t get the association automatically (will have to use Azure policy for that)
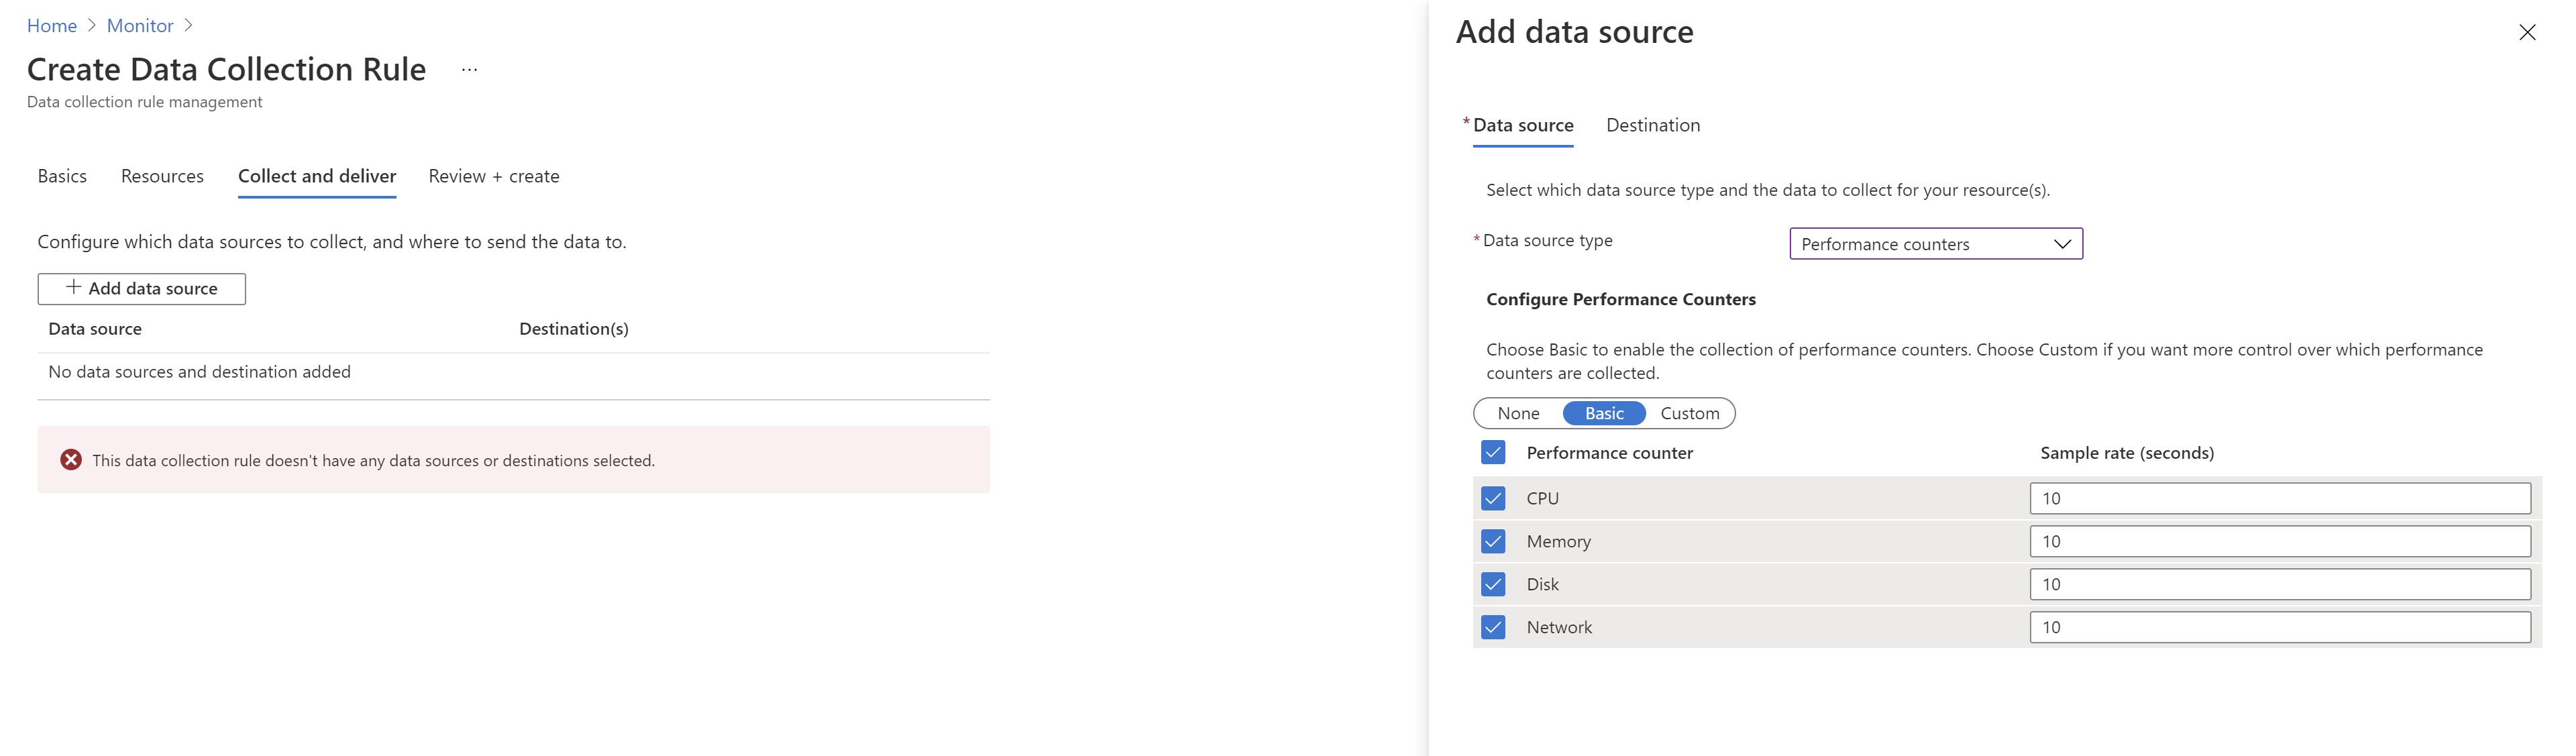
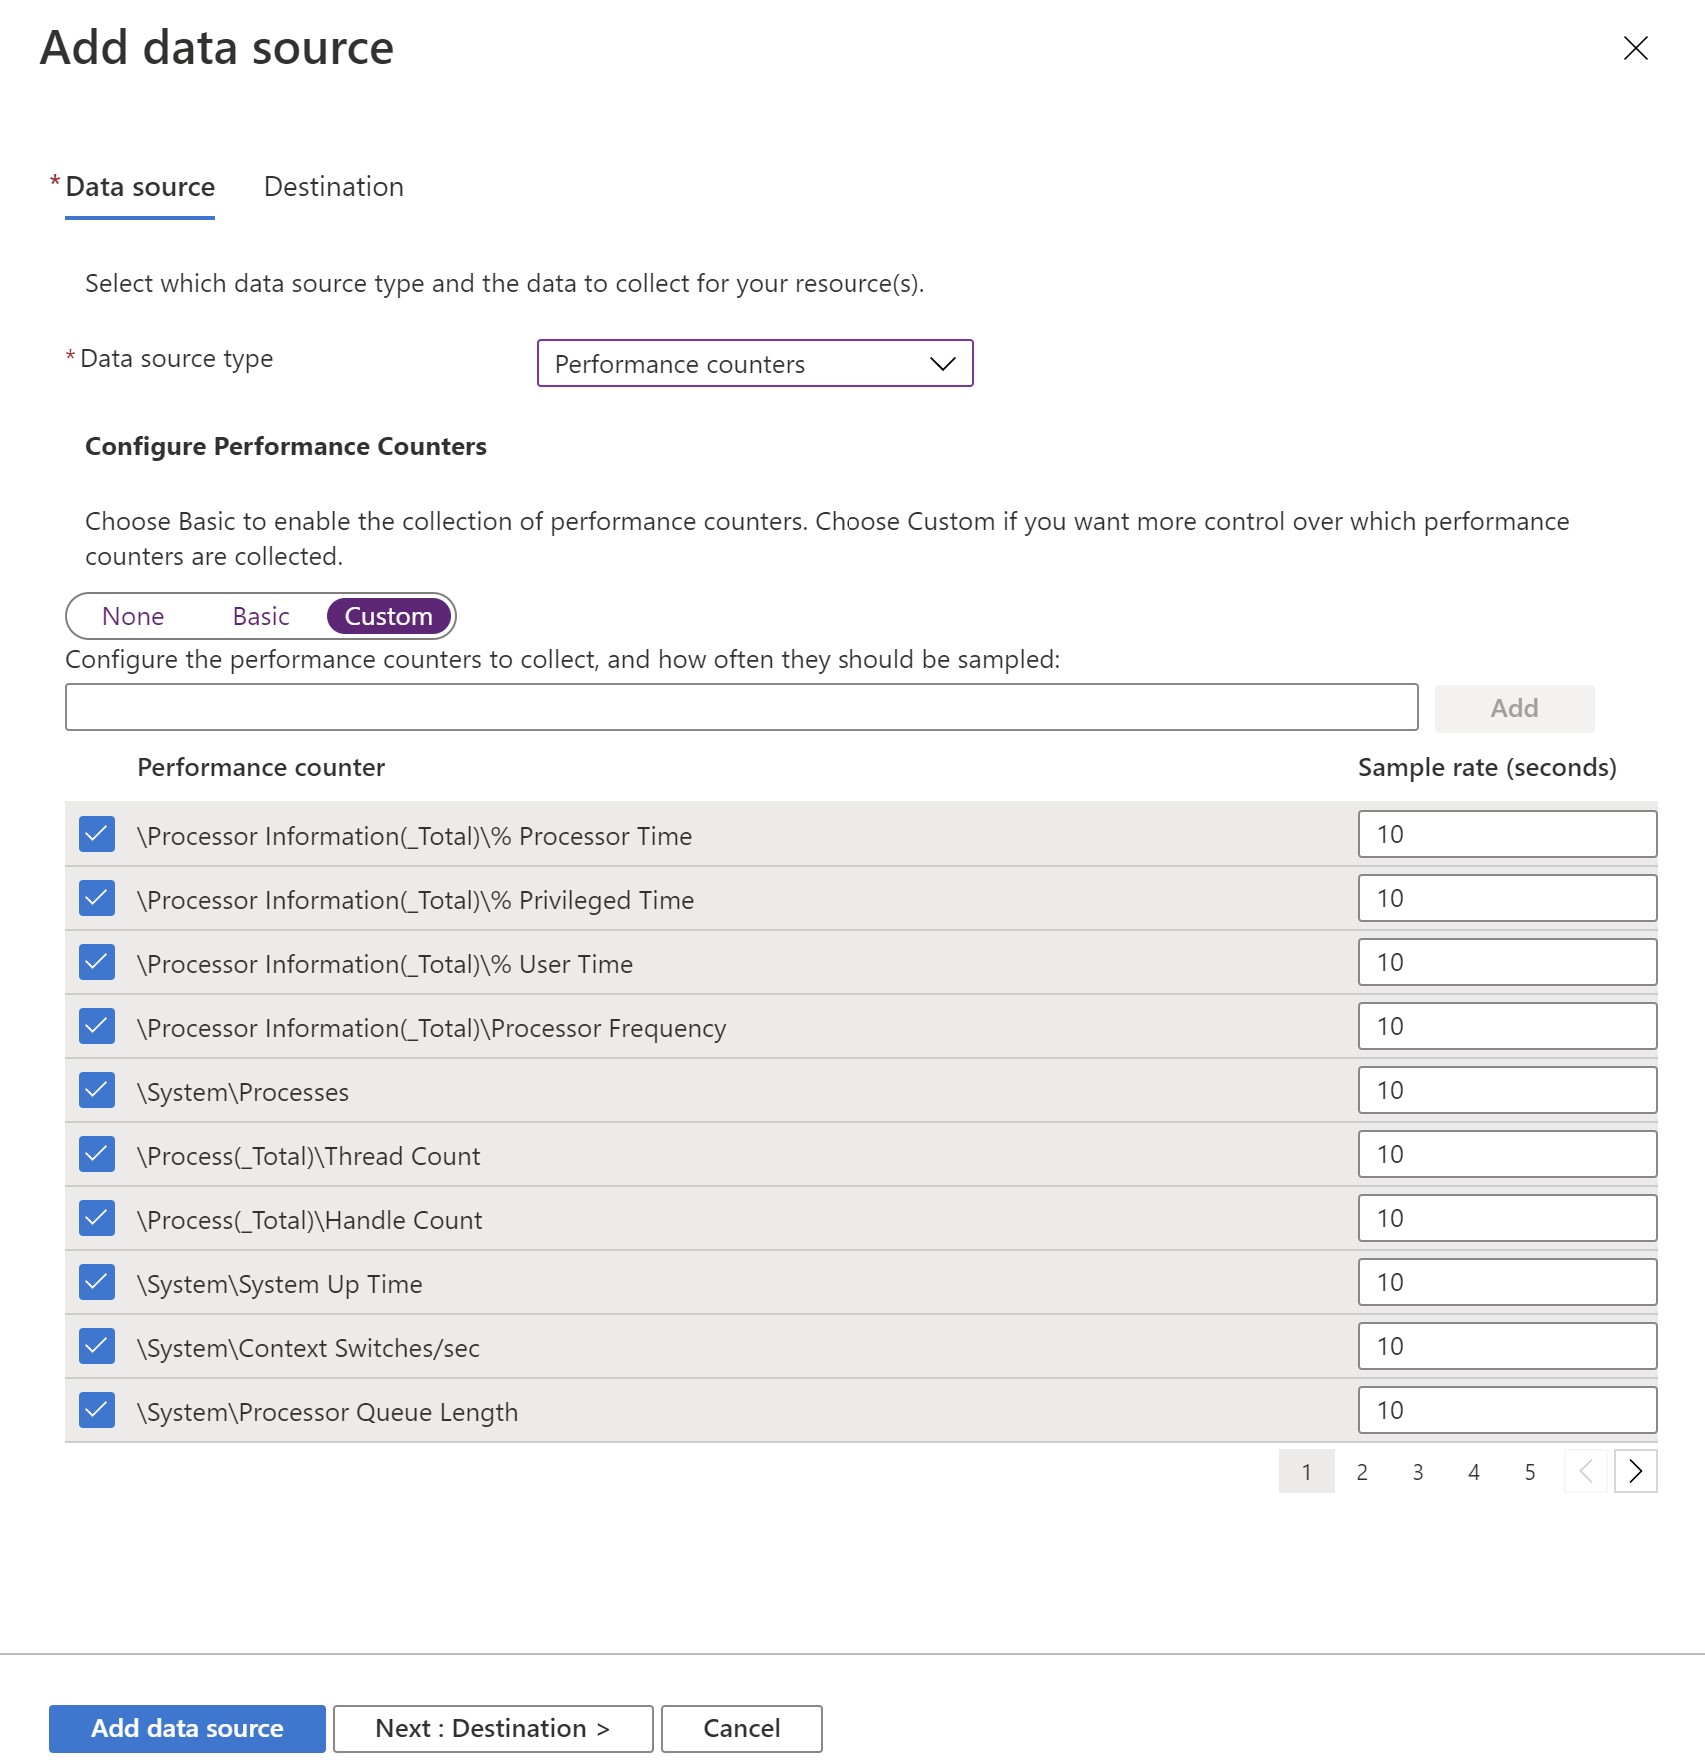
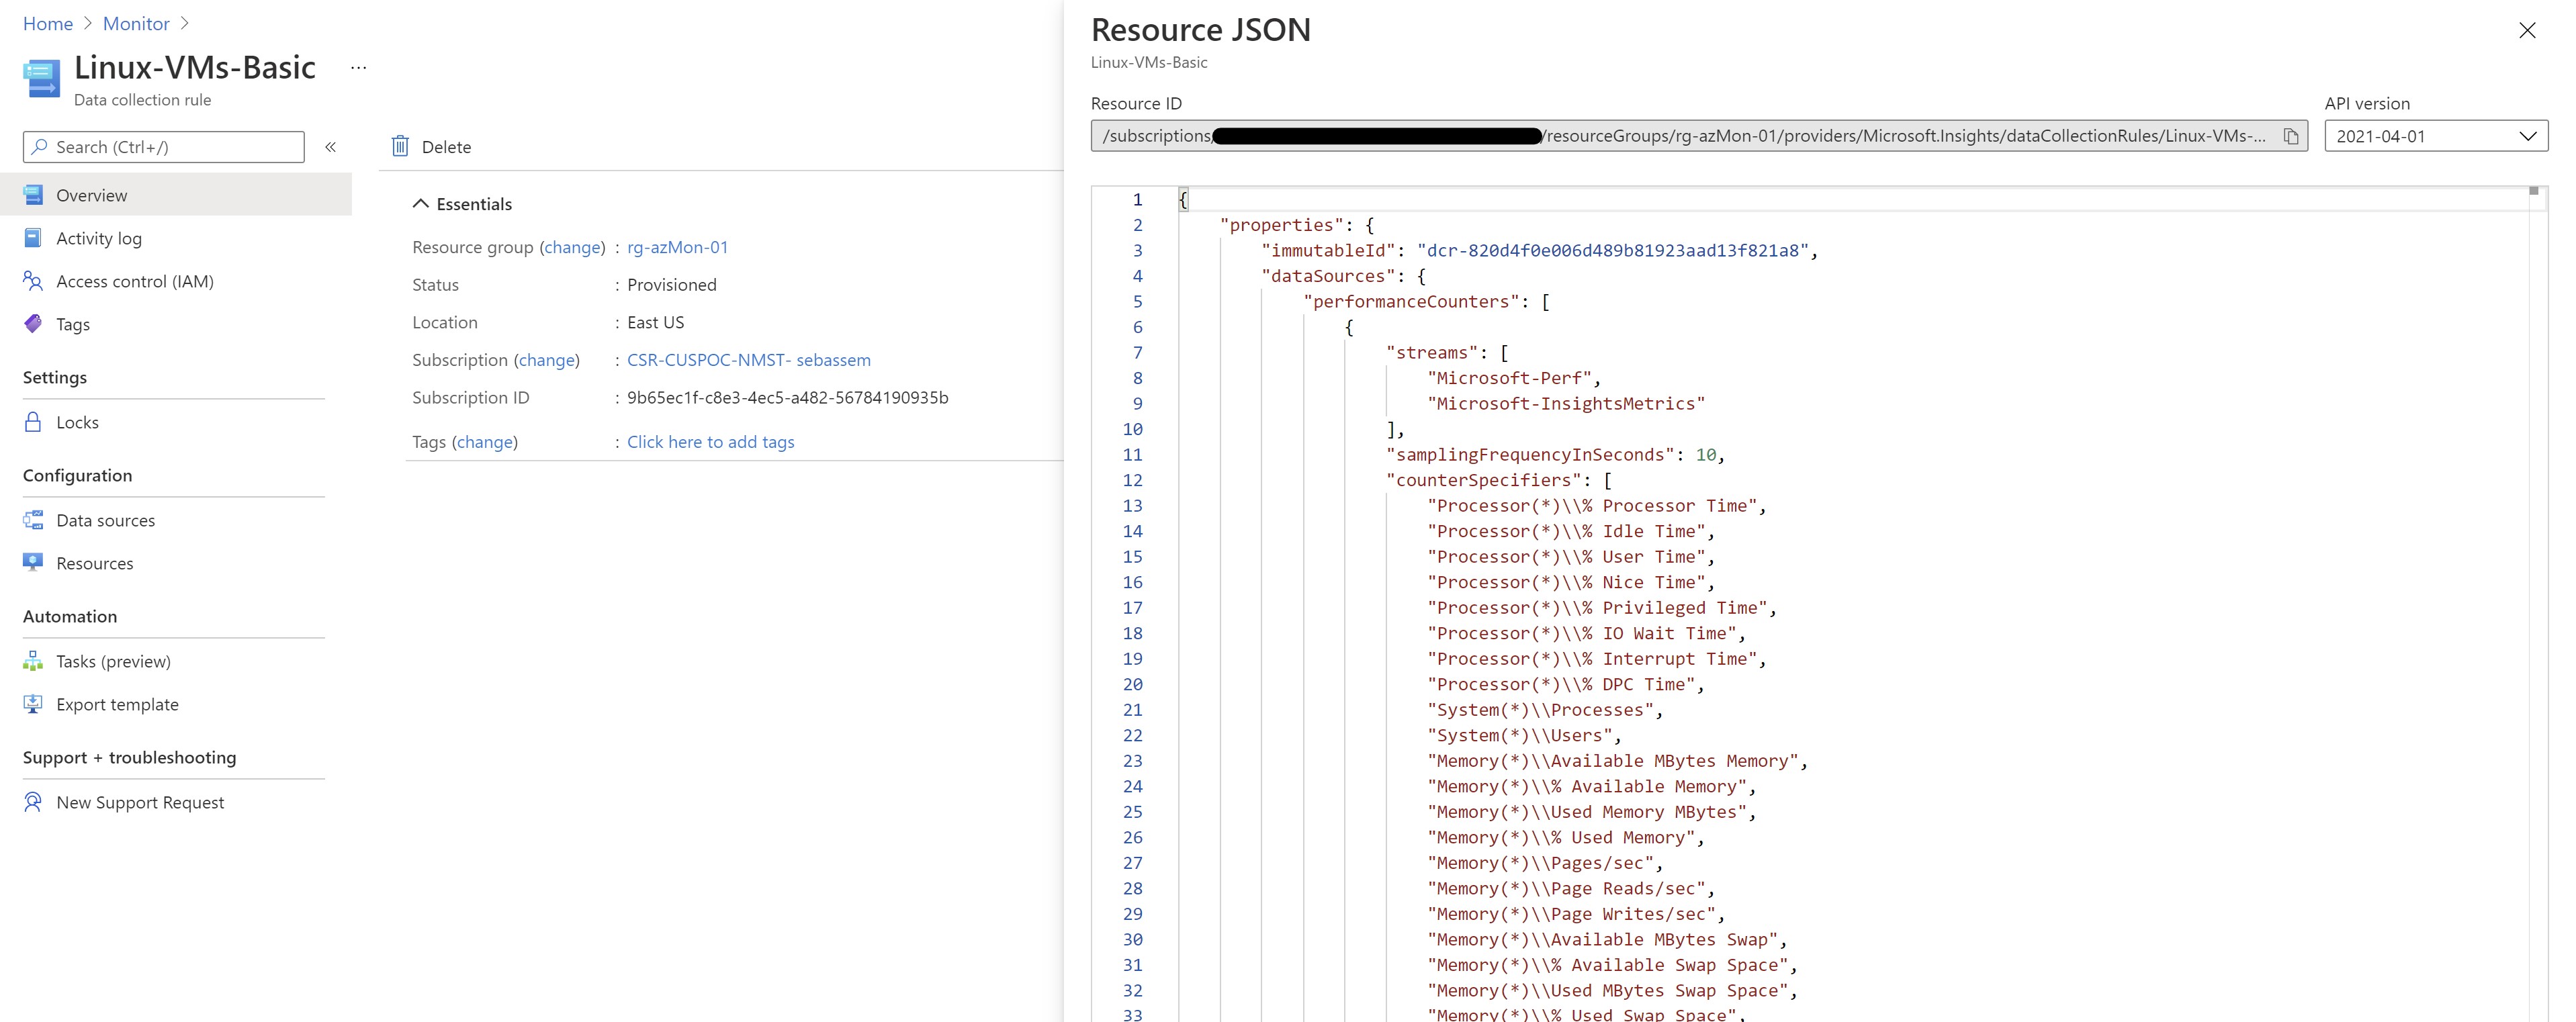
Then we need to select our data sources ; what do we want to collect from those VMs?. I will select performance counters first and we can see that we can use the basic counters or go more granular
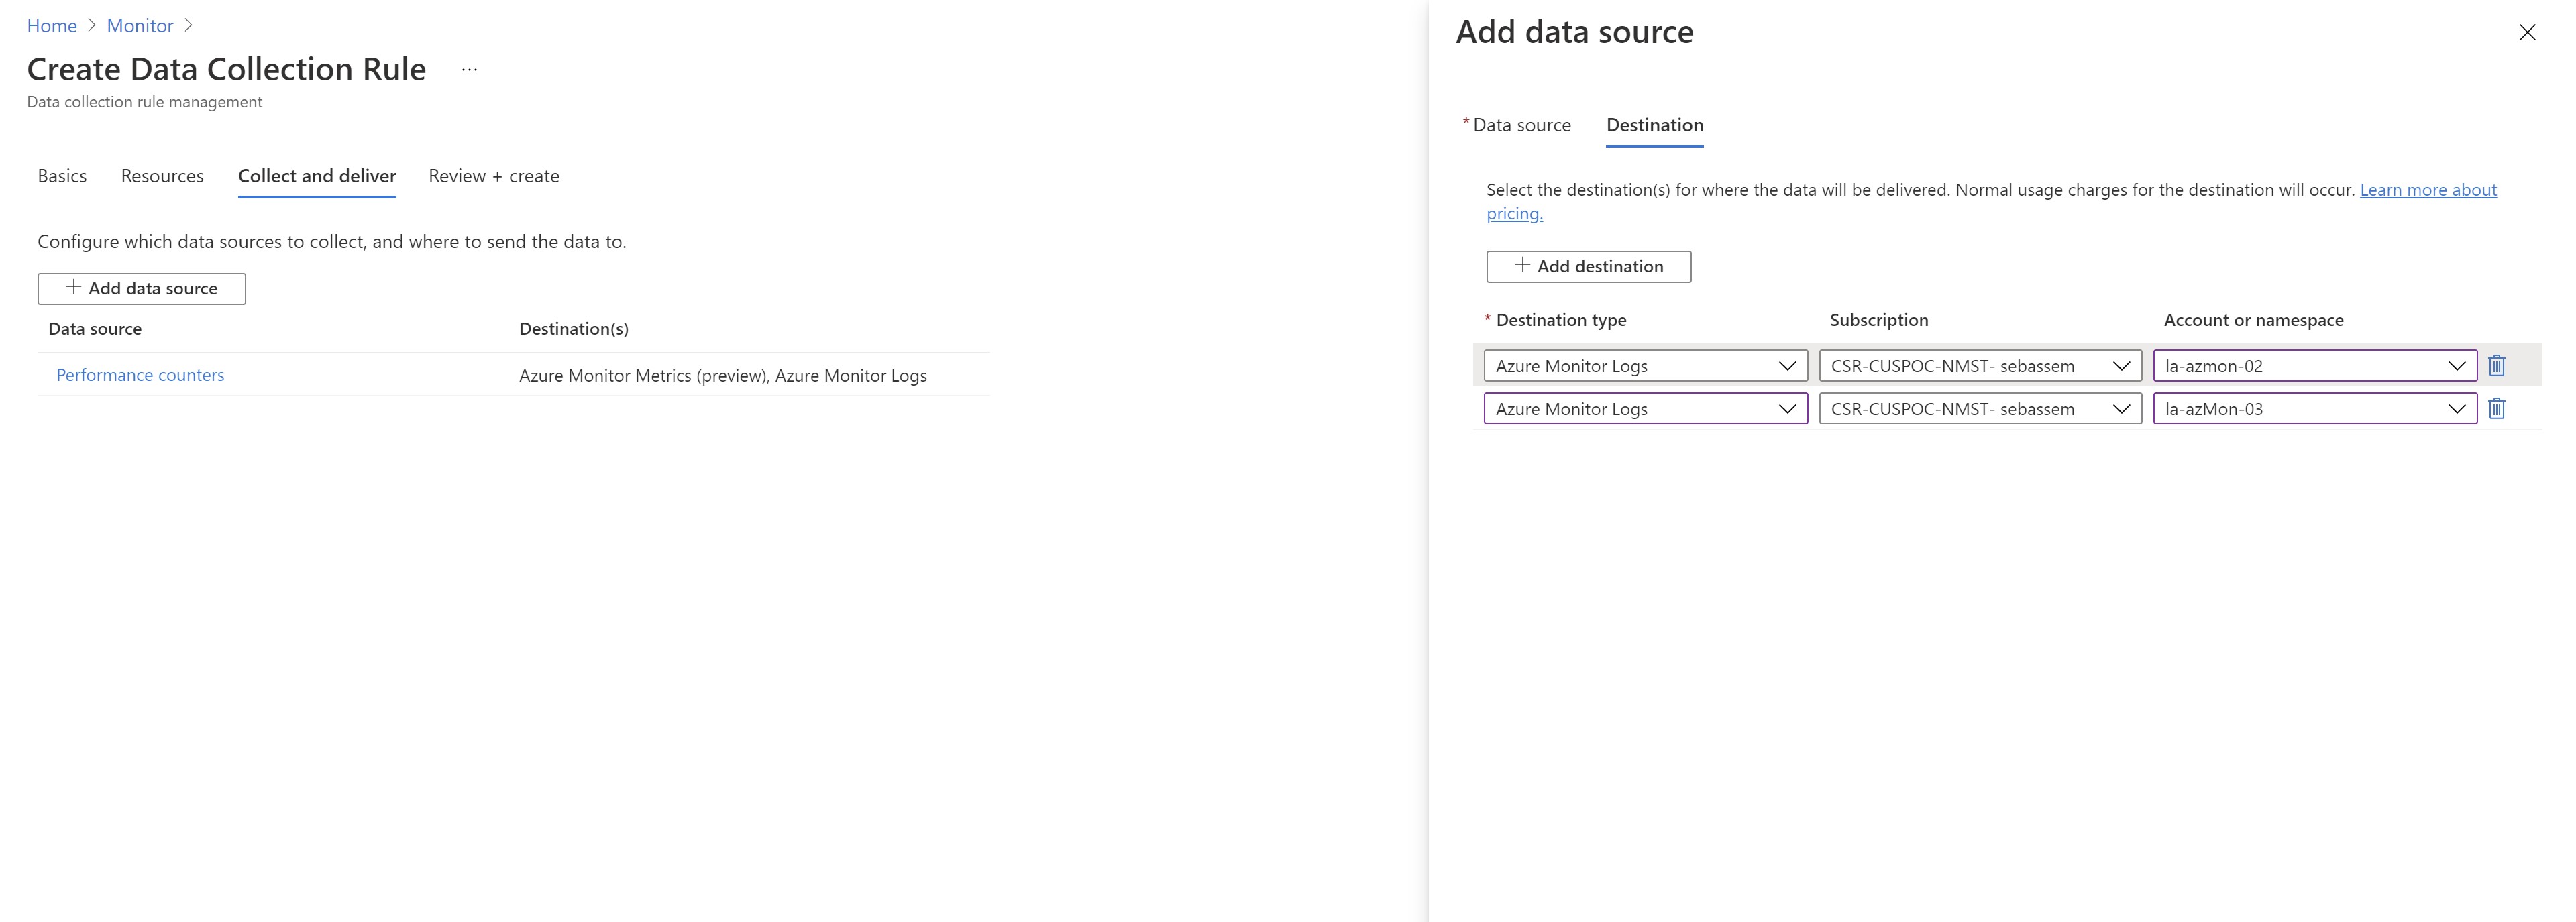
Then we need to select where we want to send those counters/Metrics ; there is the default metrics destination and i can also select a log analytics workspace (in the same region as the DCR) or multiple ones if it makes sense for me.
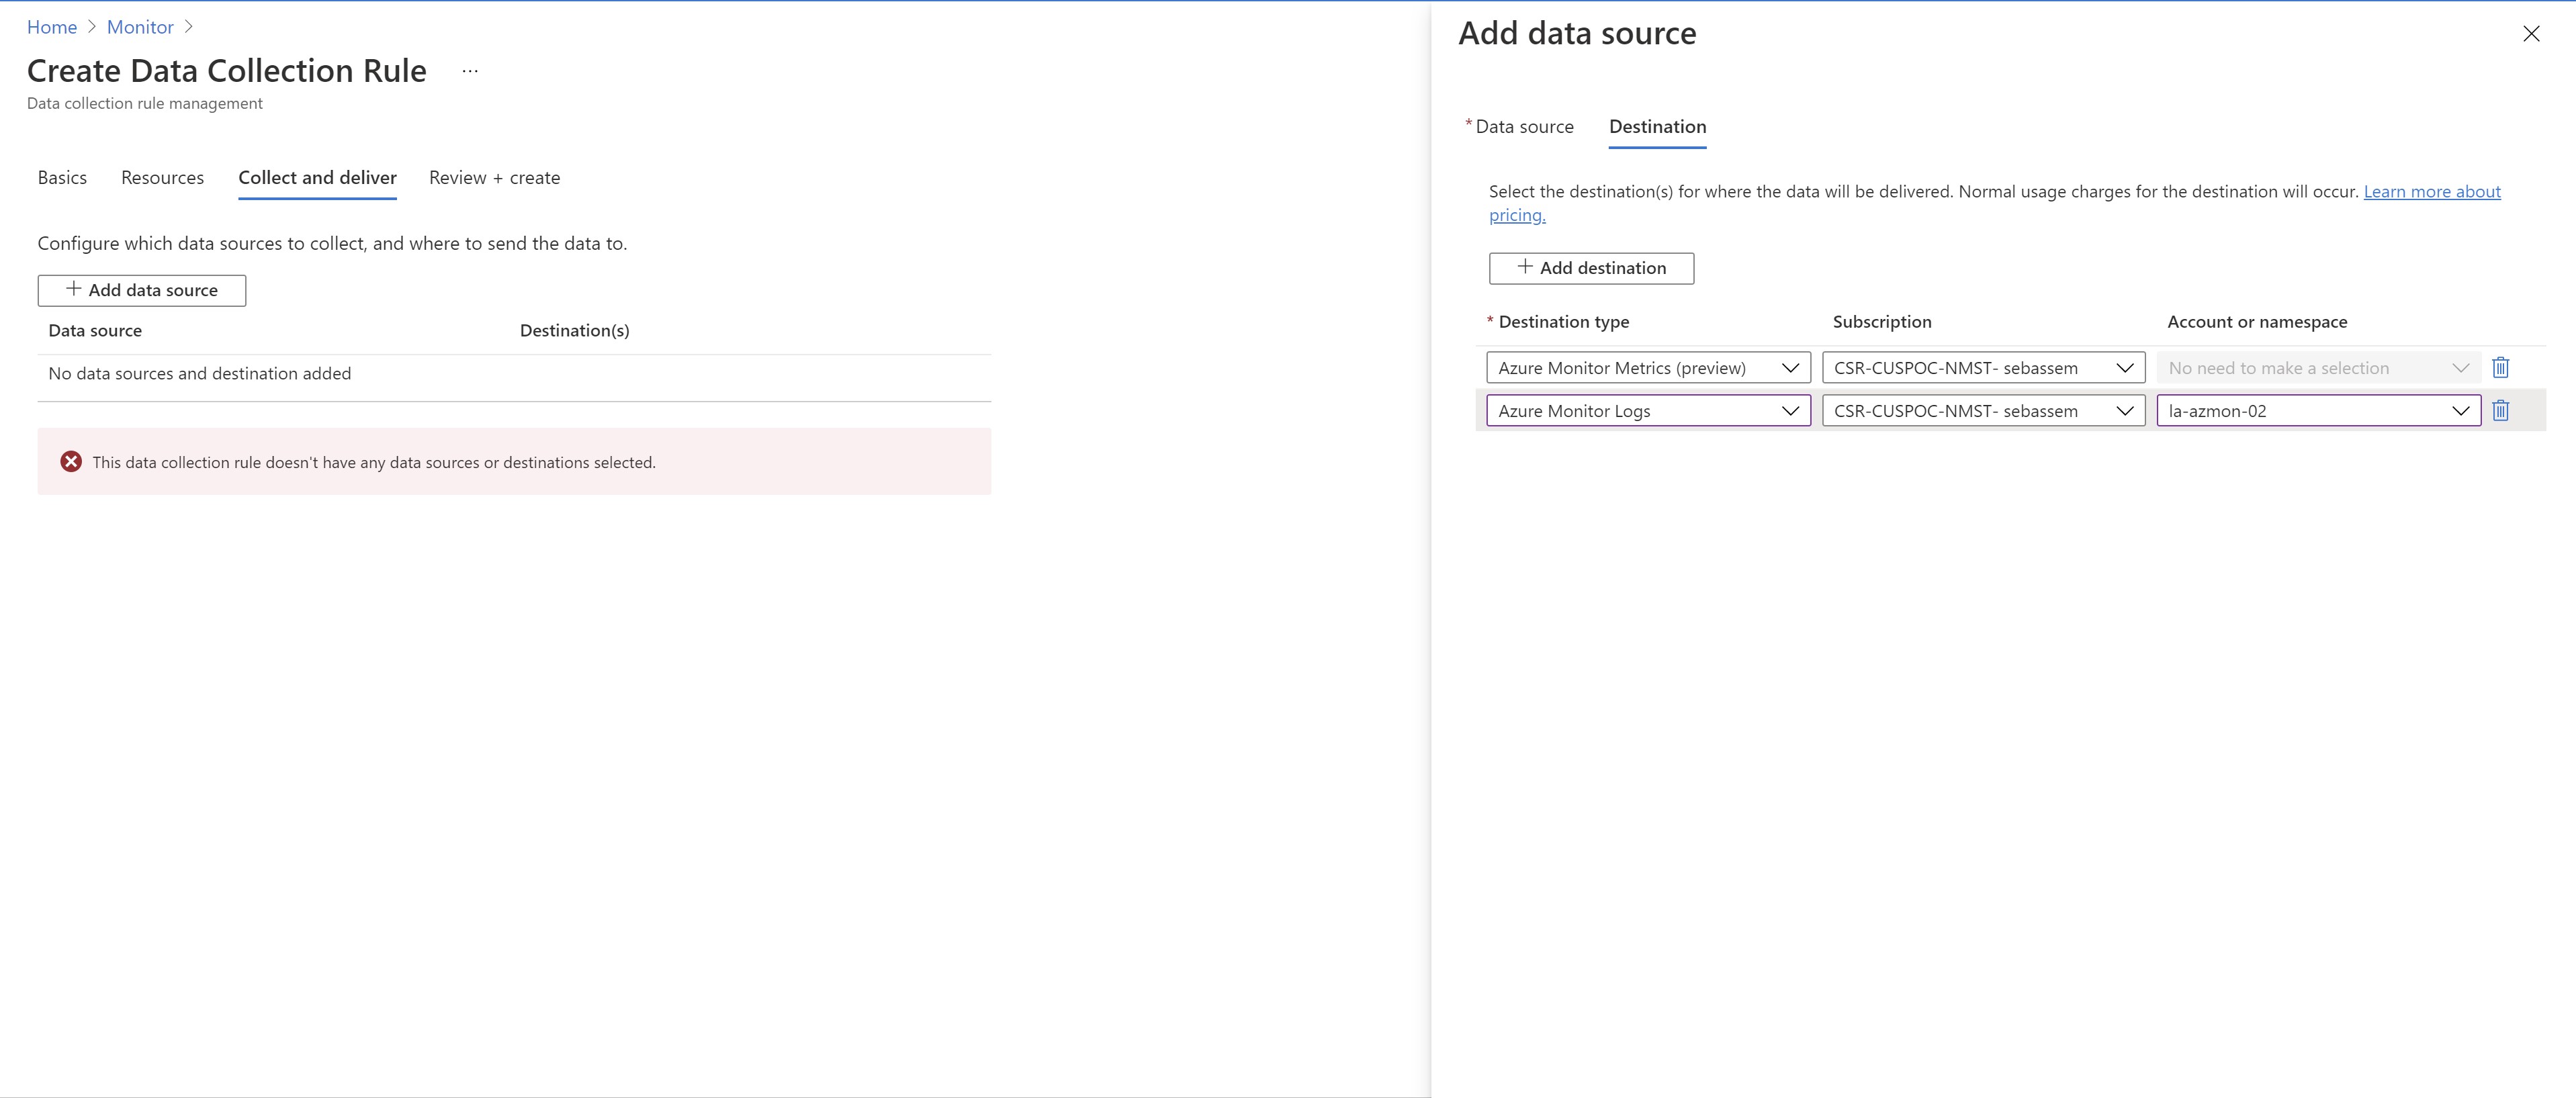
Next ,i will add another source . In this case ,i will select some windows event logs and will configure multi-homing to send them to my existing workspace and an empty newly created one.
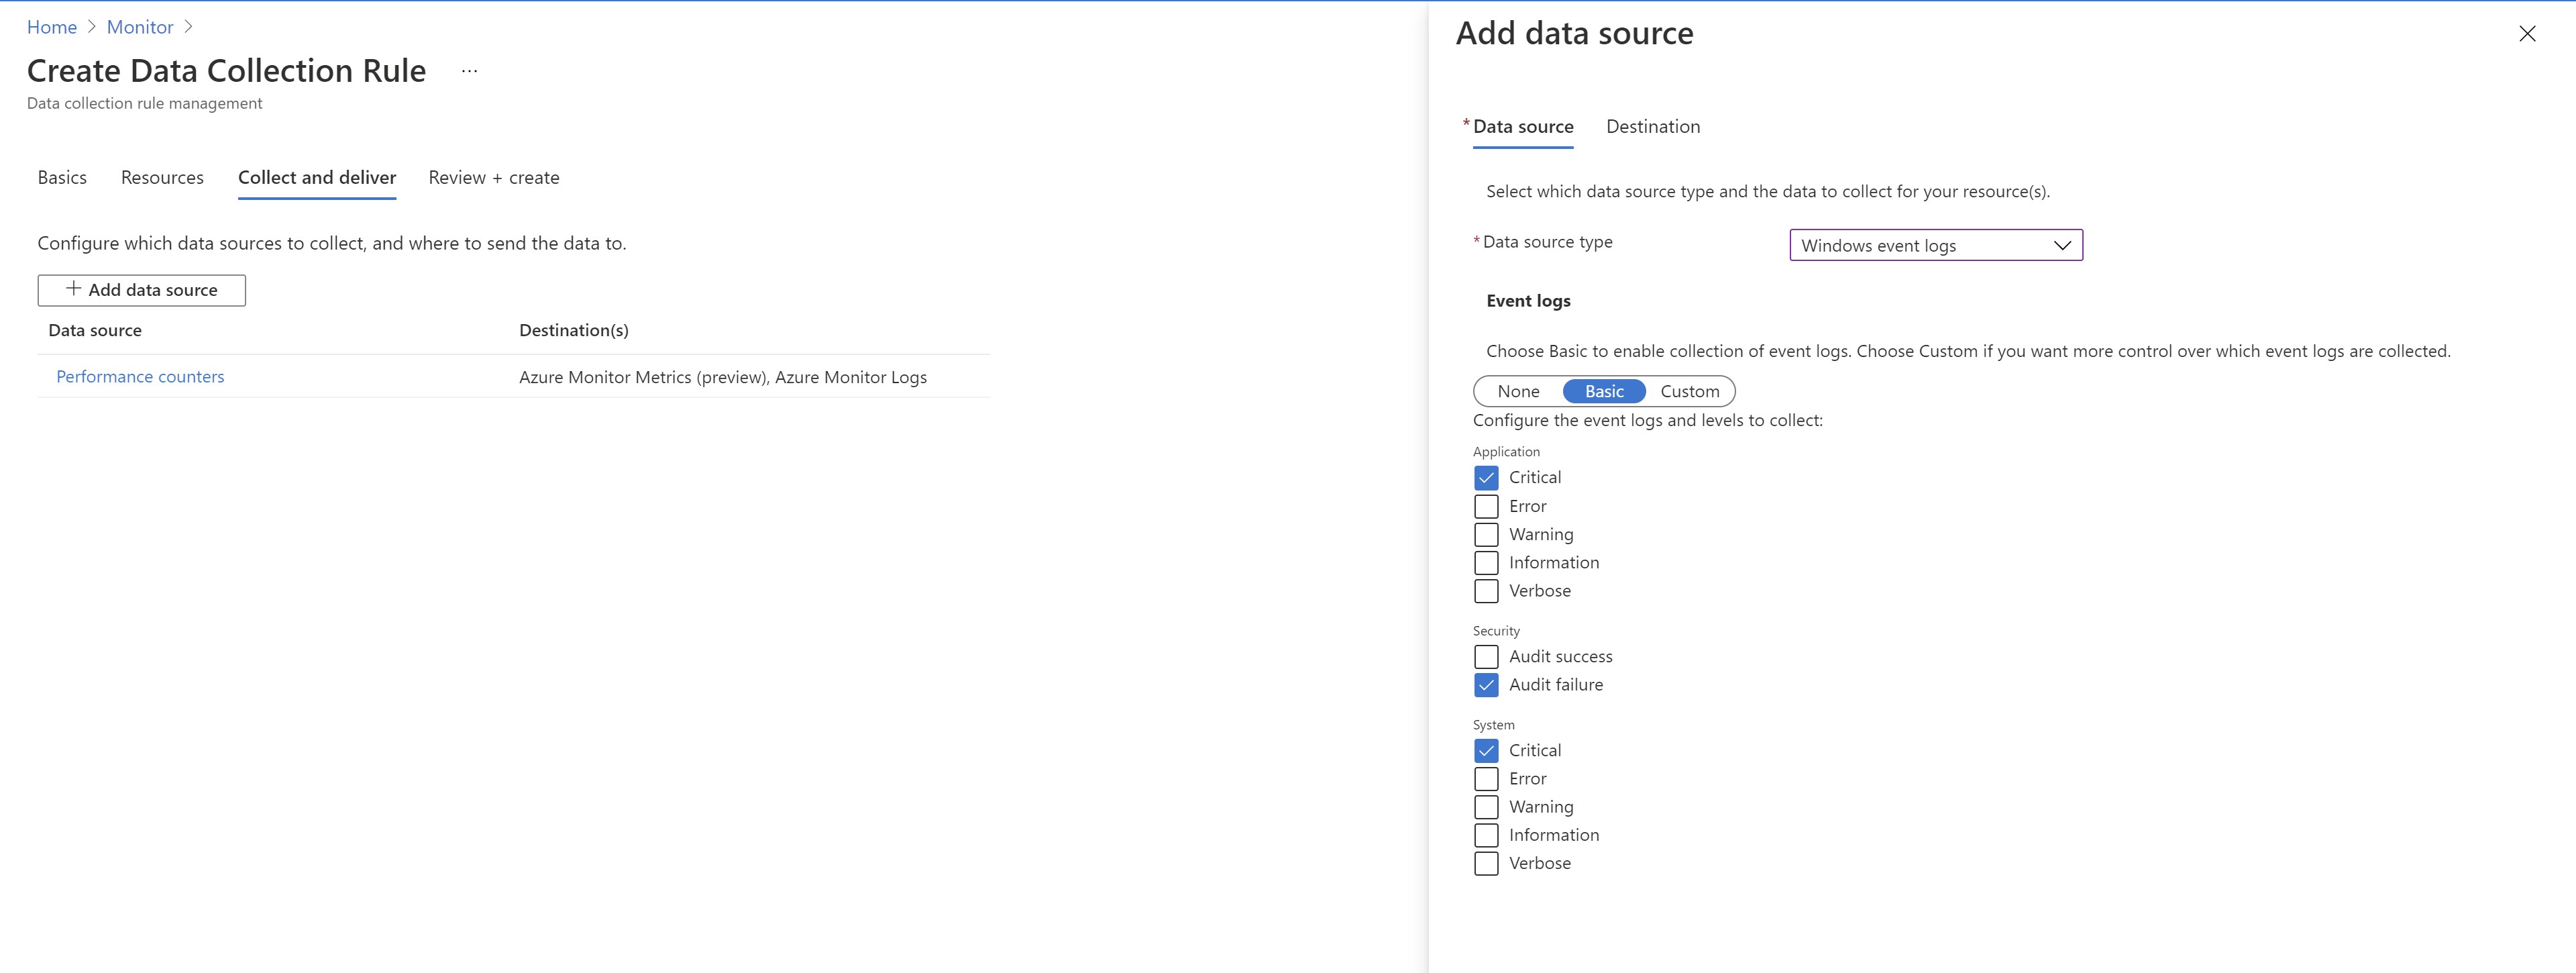
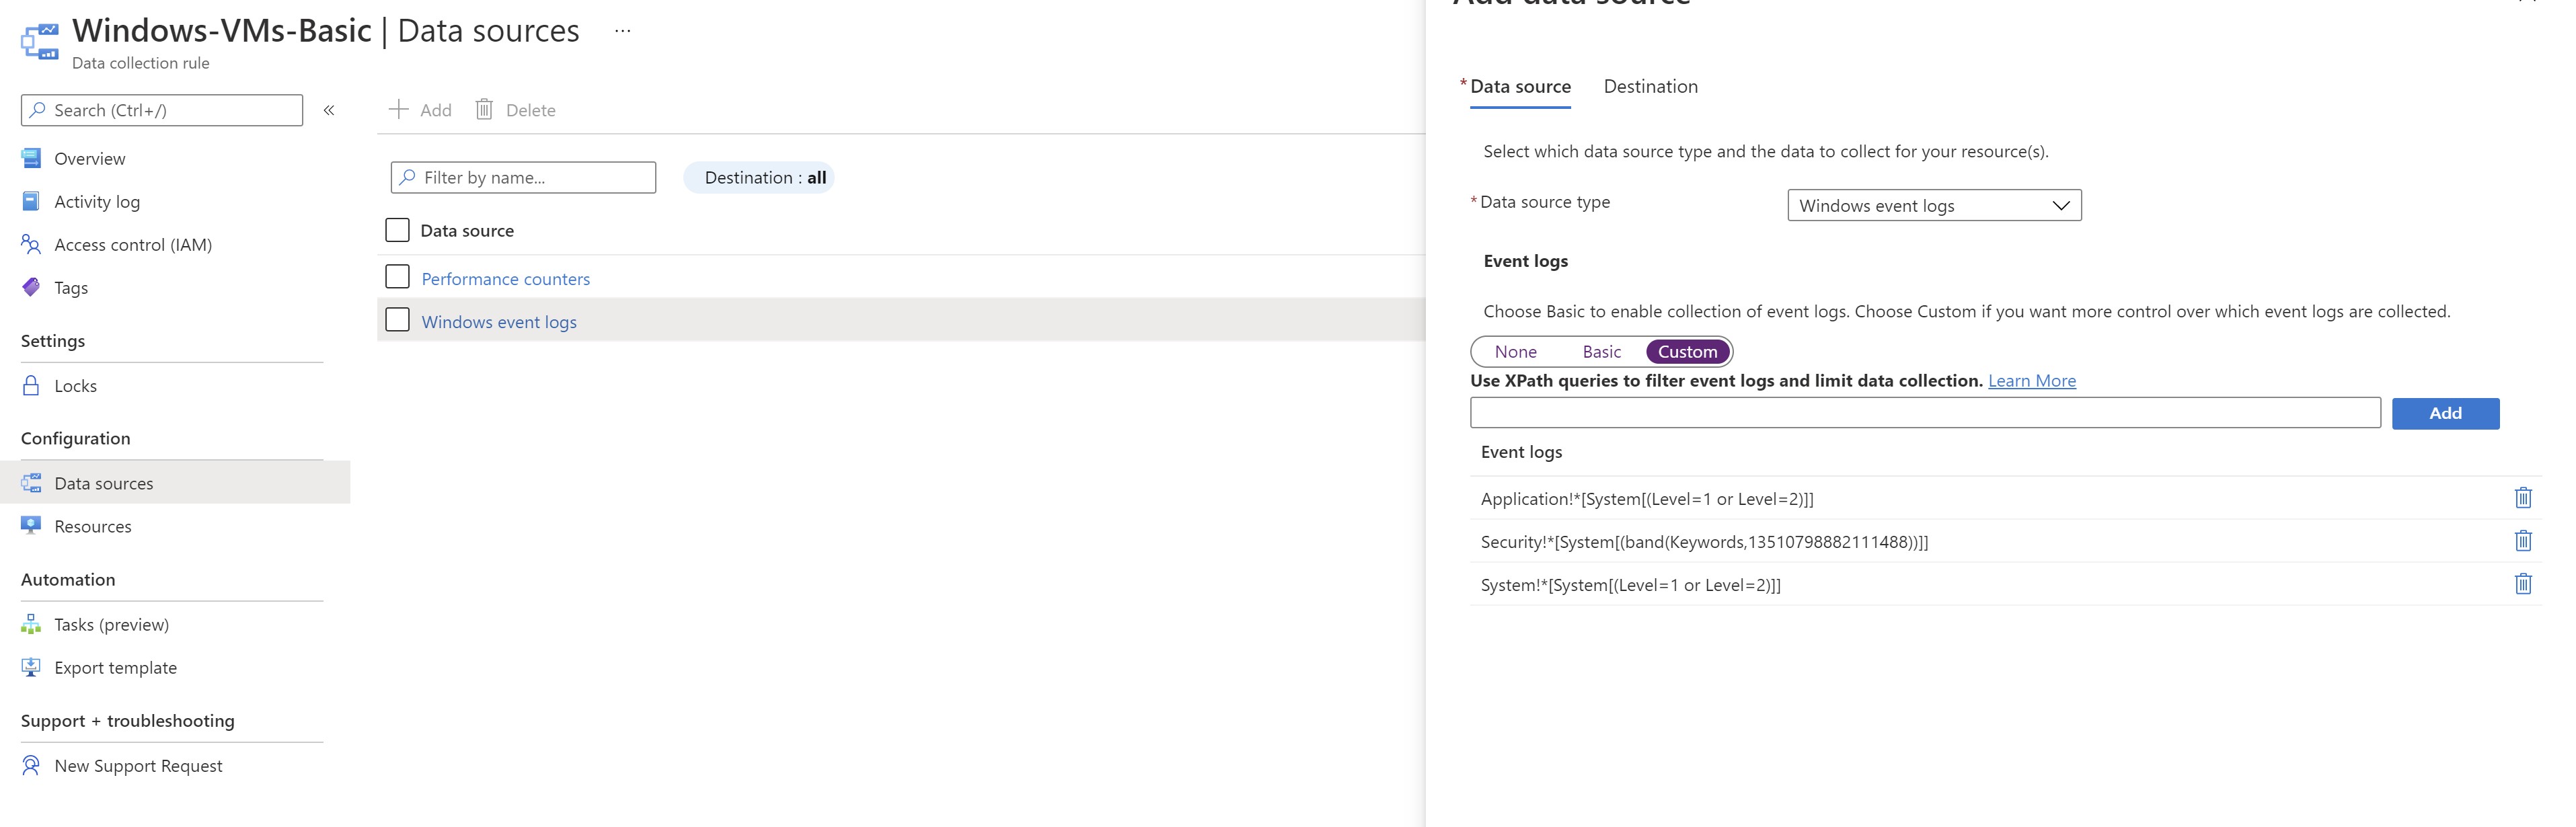
We can also filter out event logs to limit data ingestion
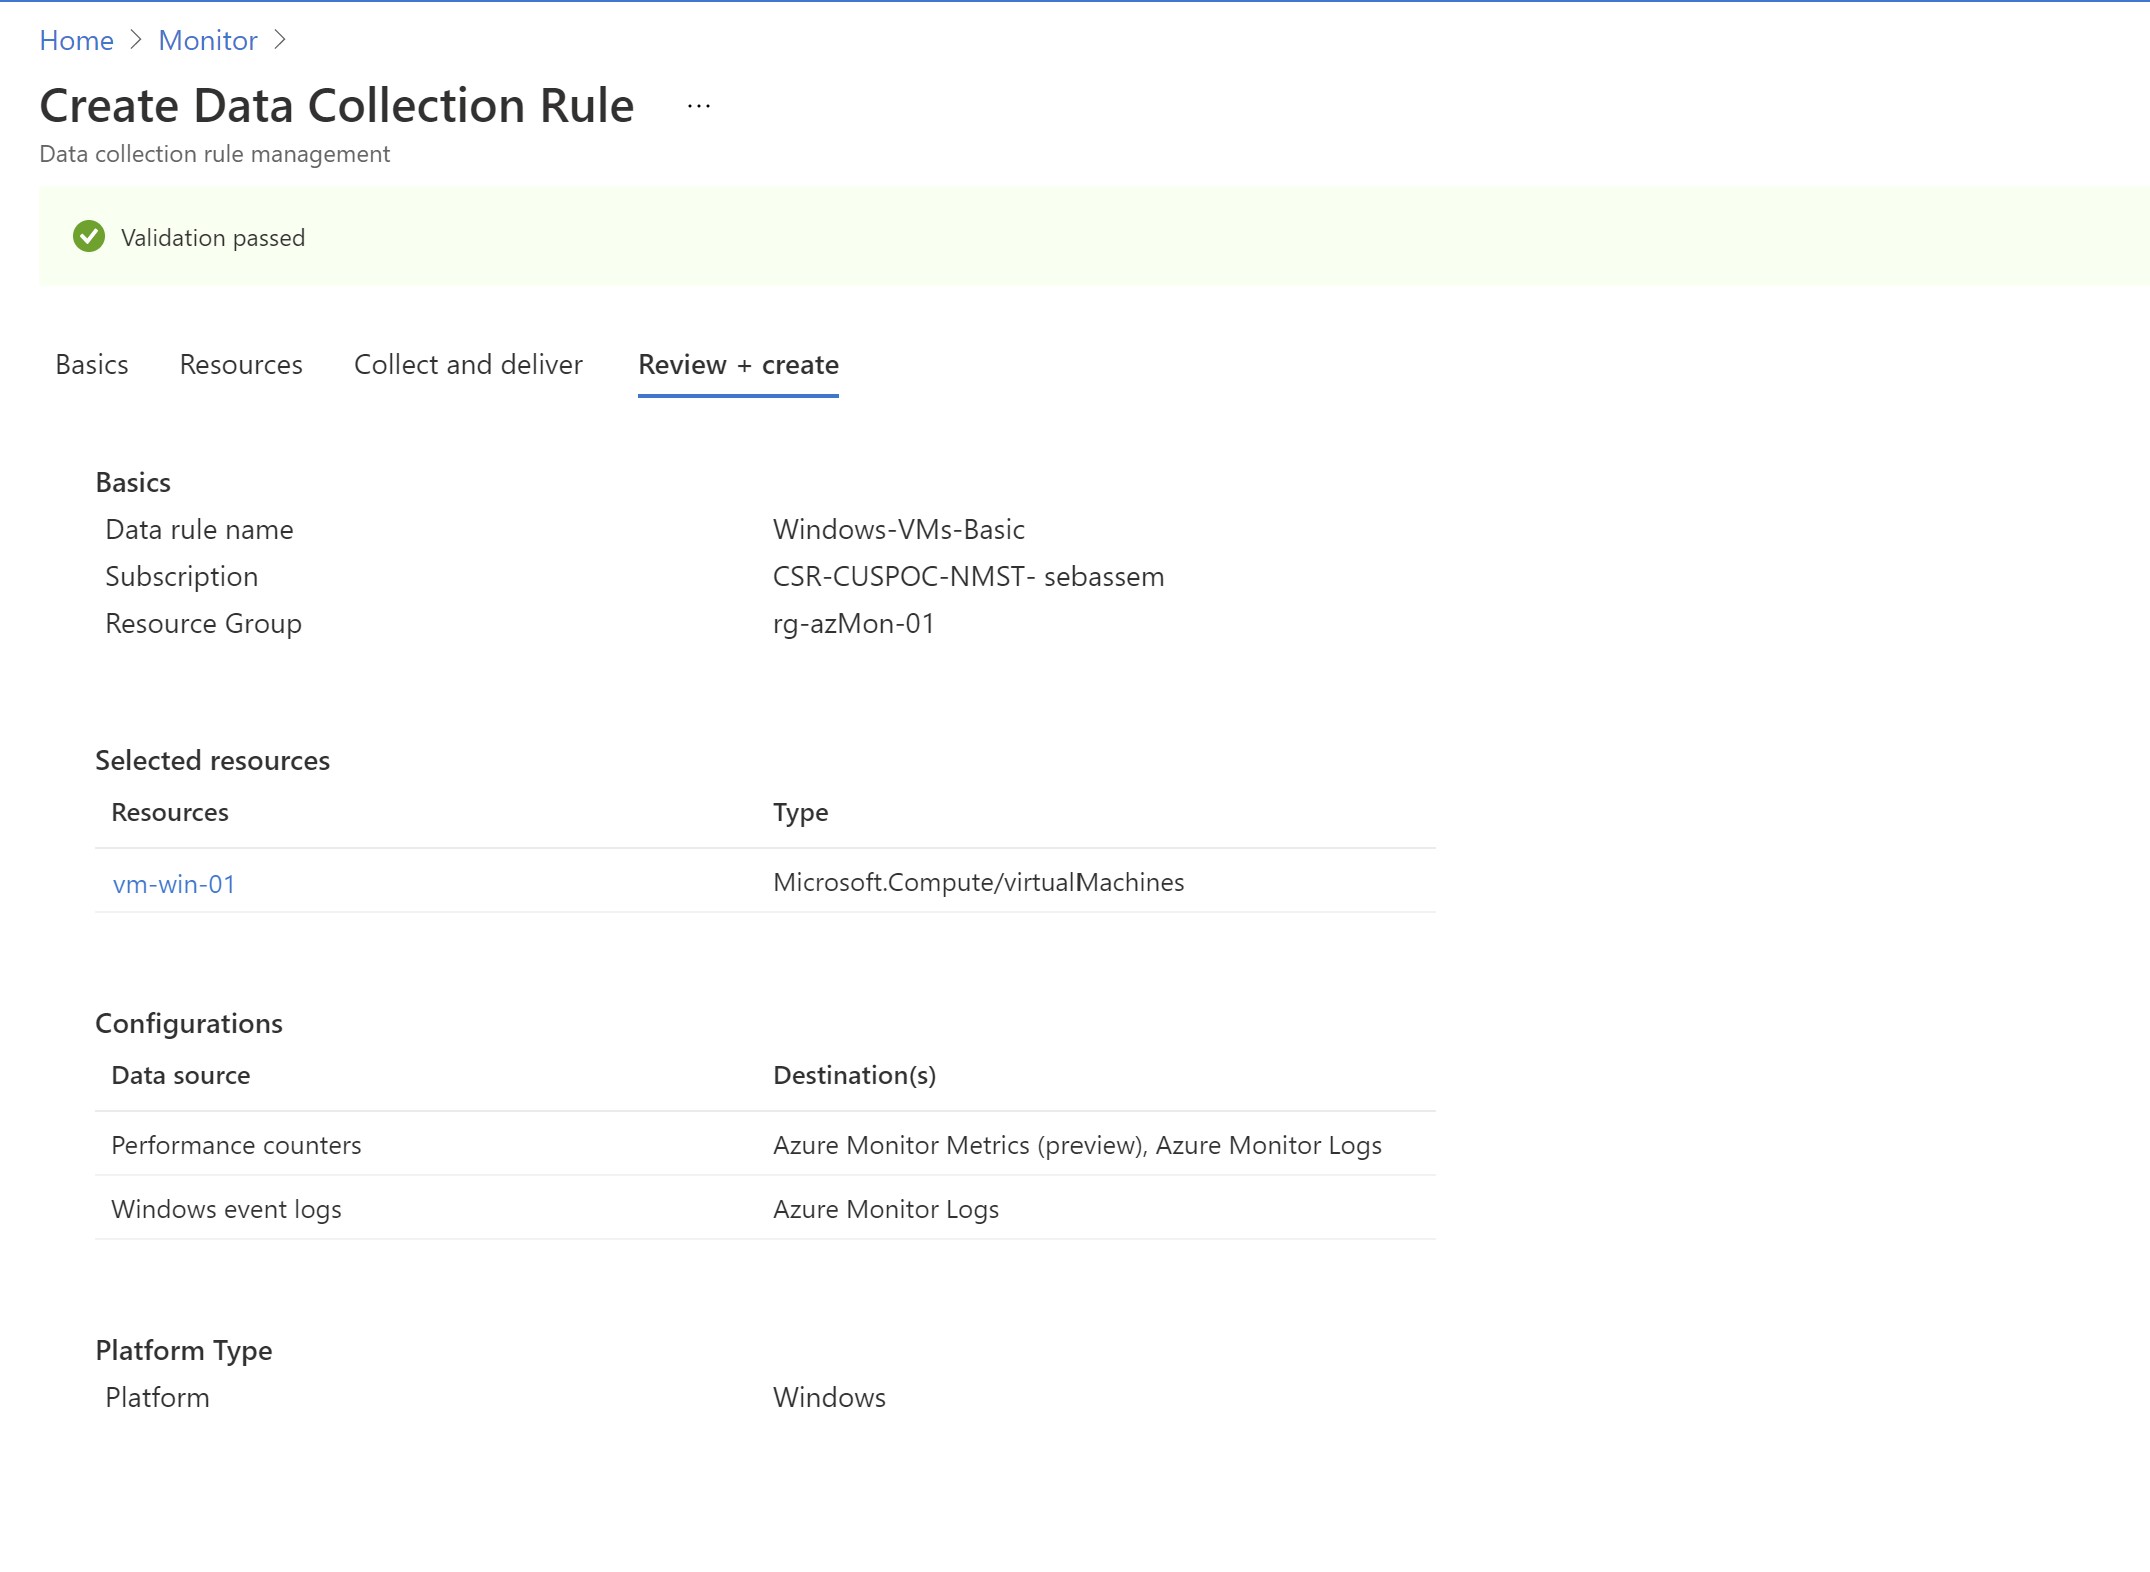
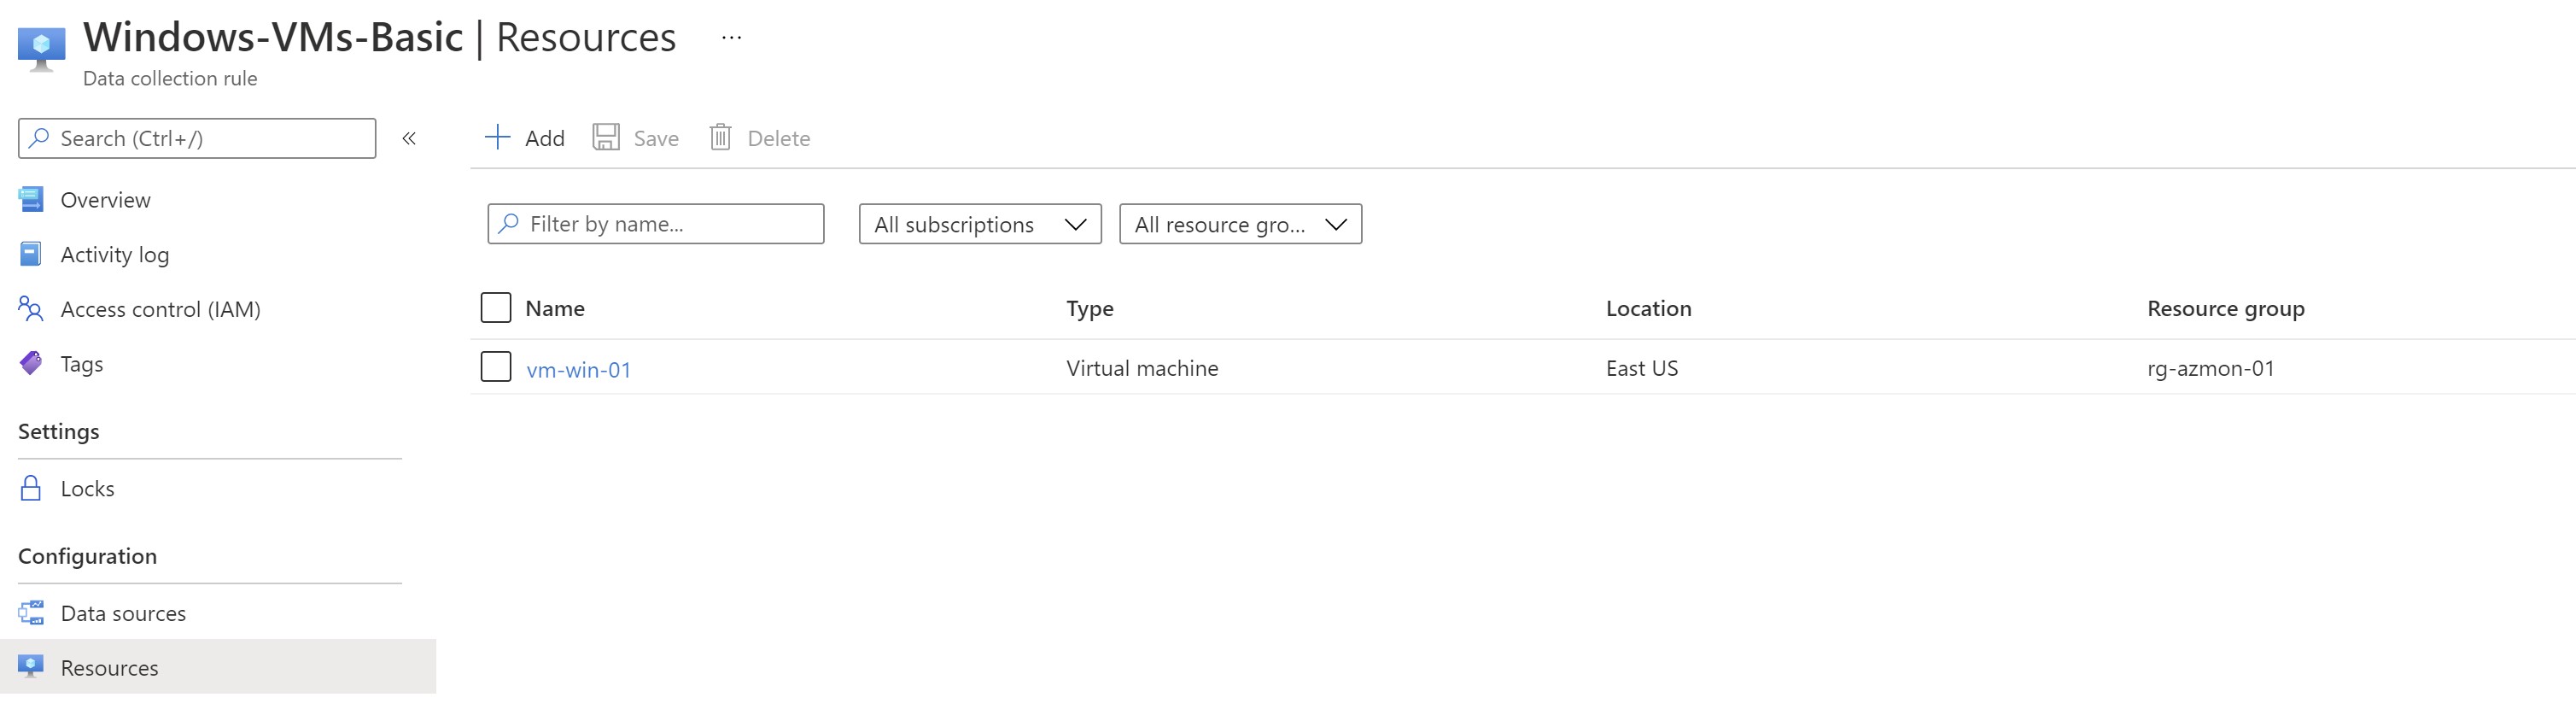
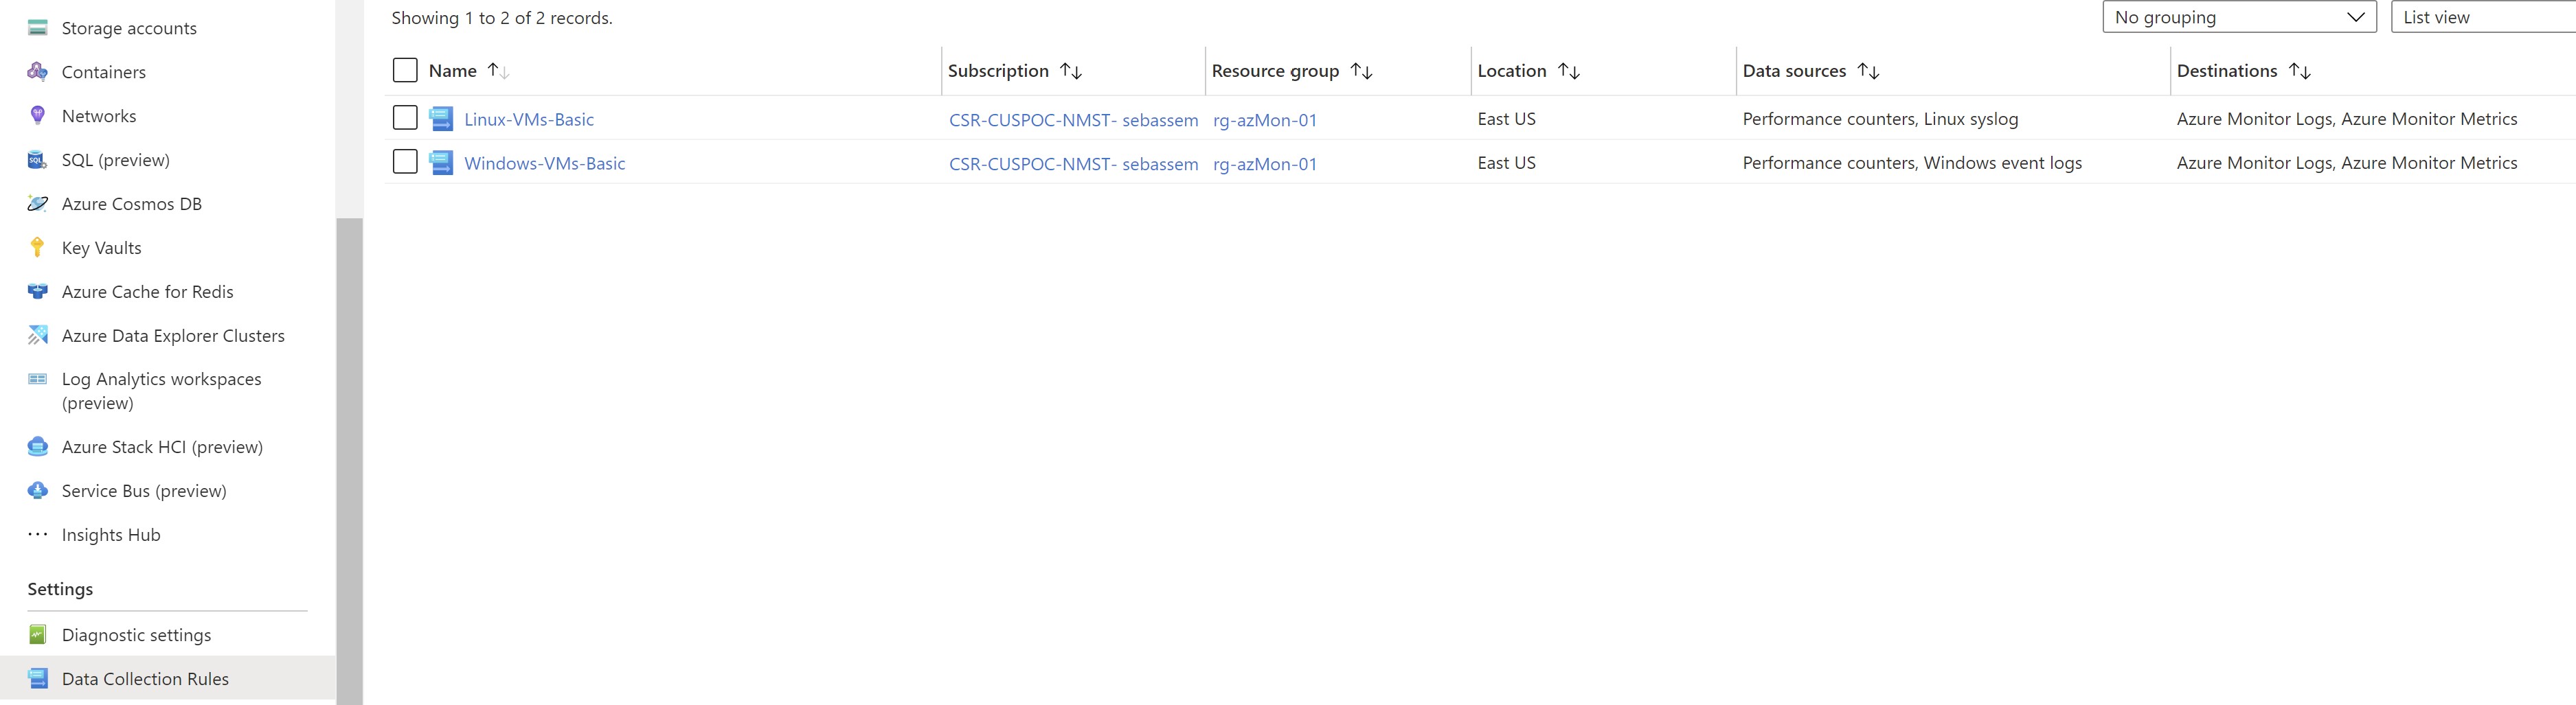
Now ,our DCR creation process is complete .Let’s verify if everything is working properly.
I can see my VM in the target resources in the DCR
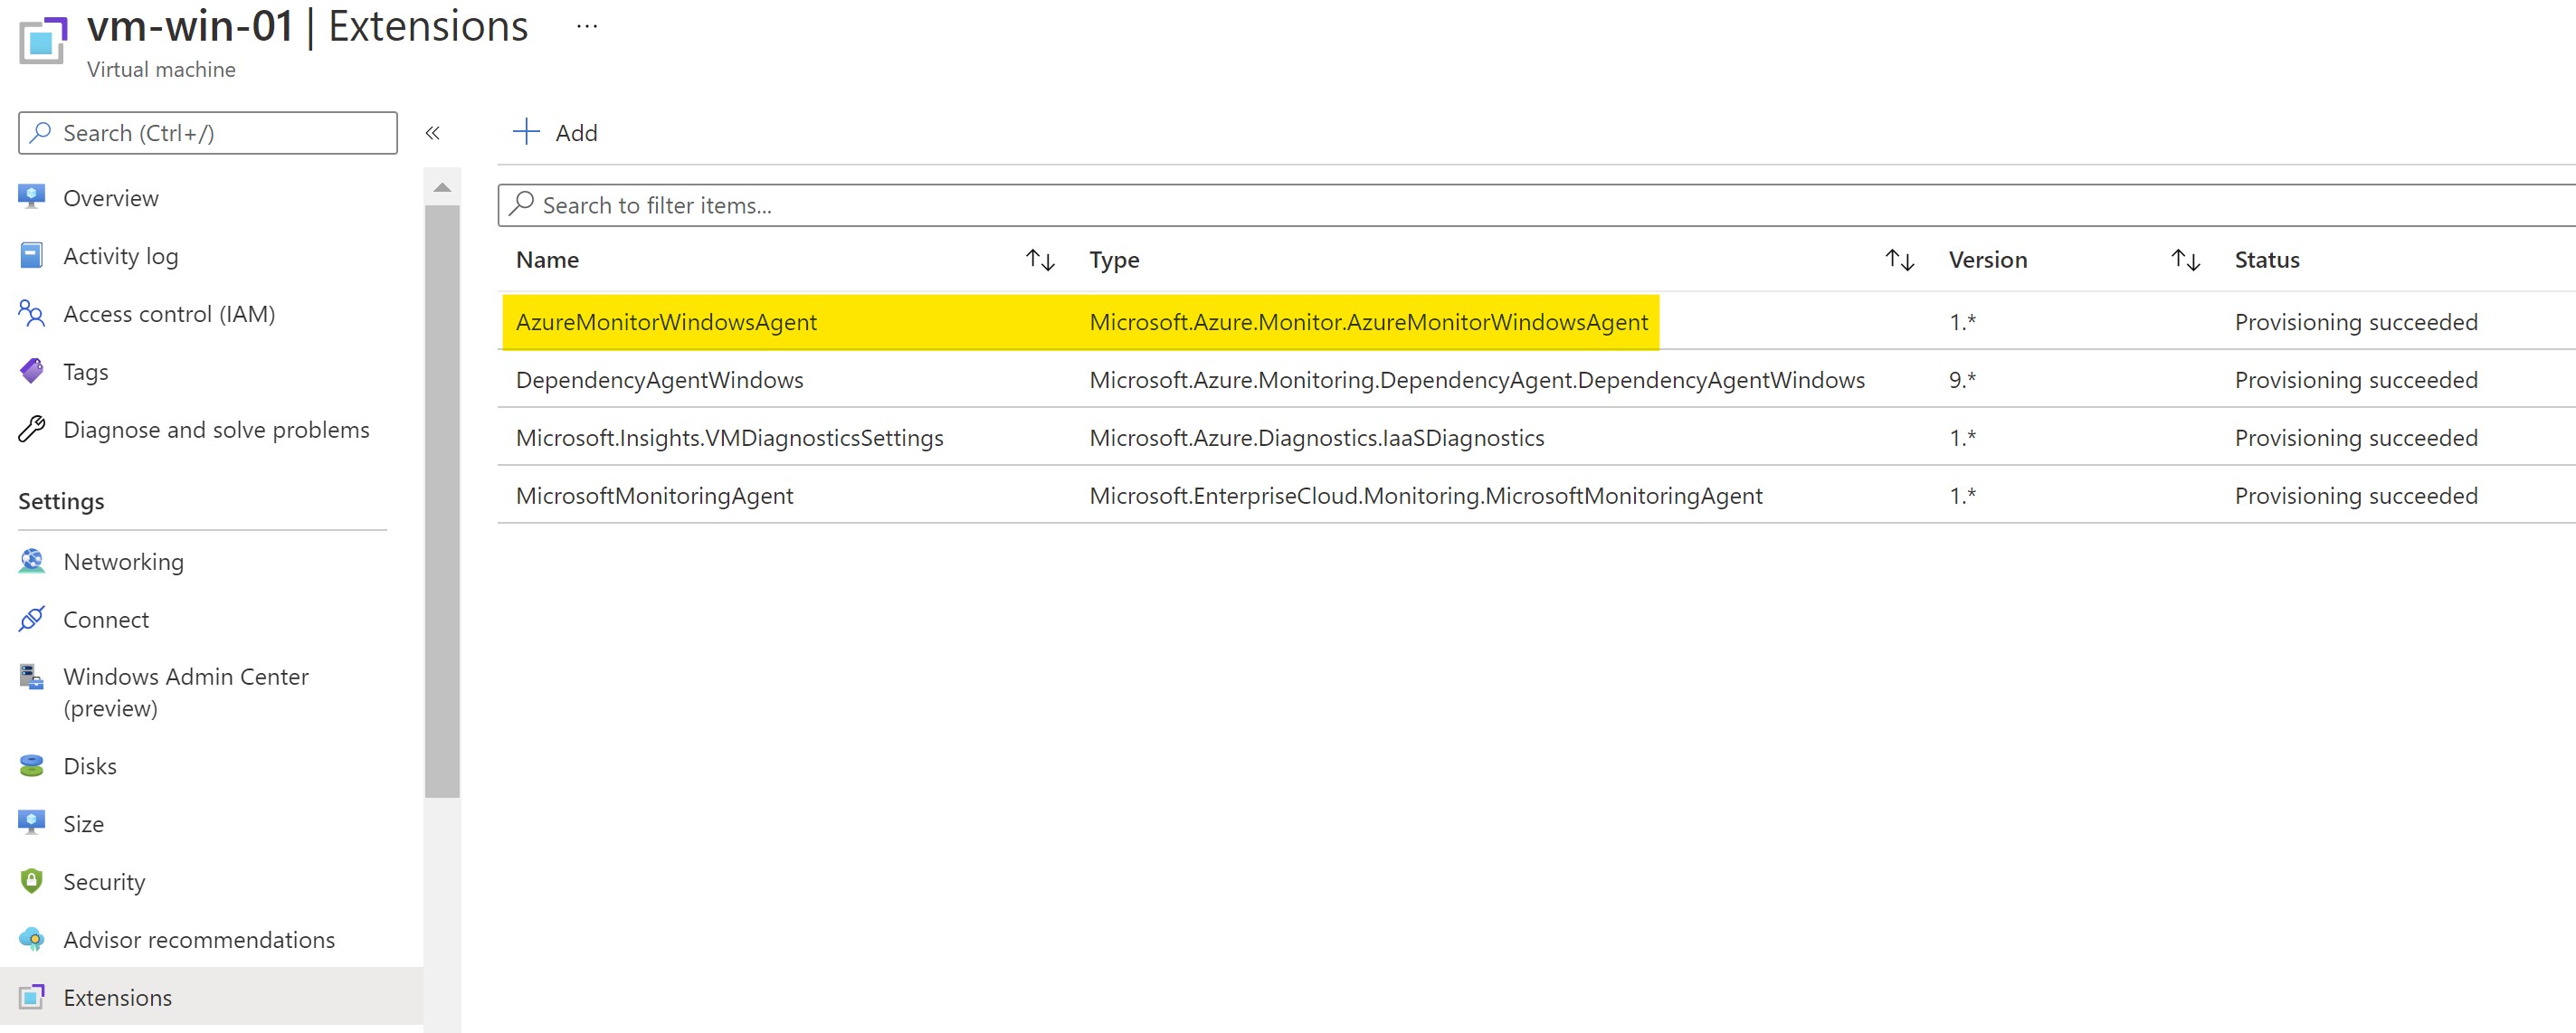
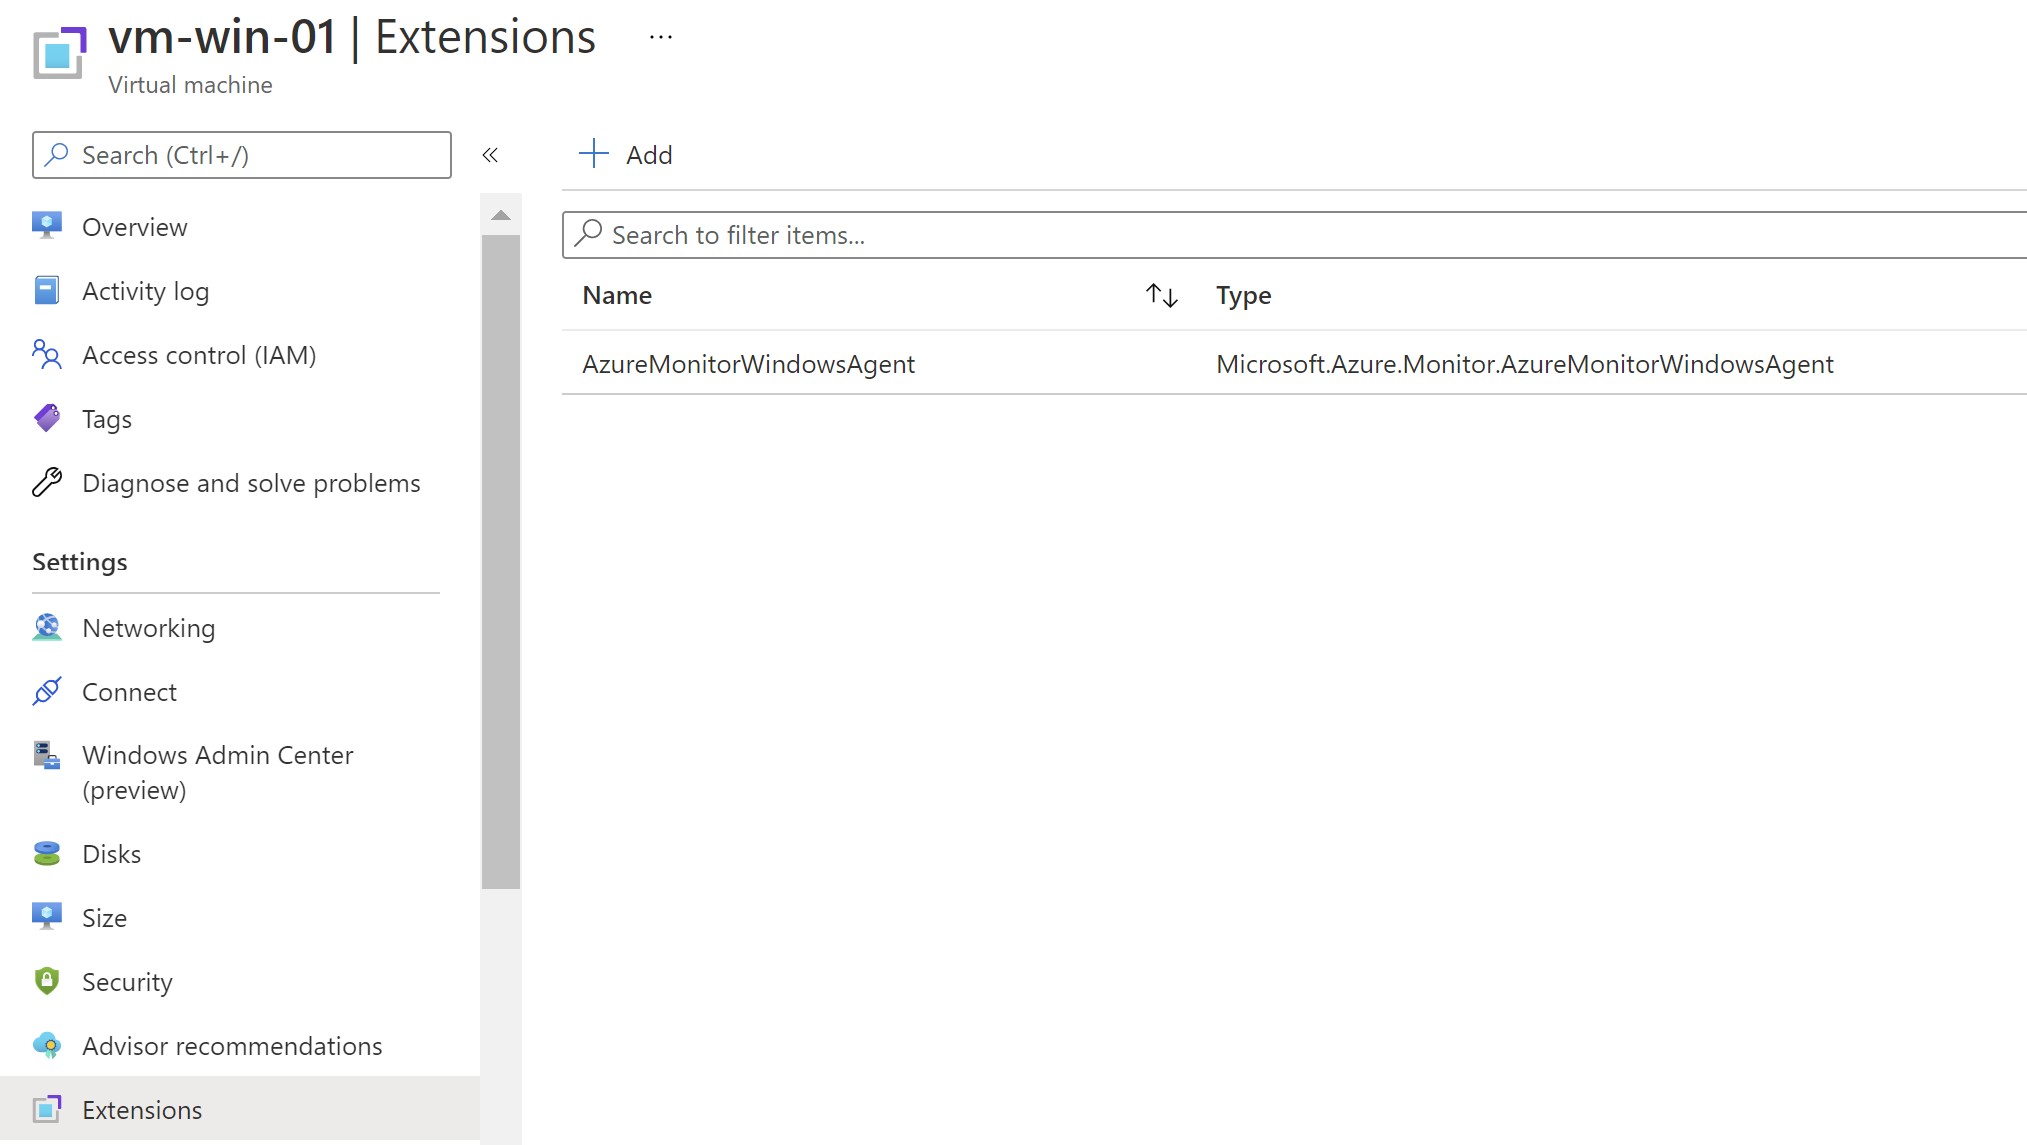
The extension got installed automatically
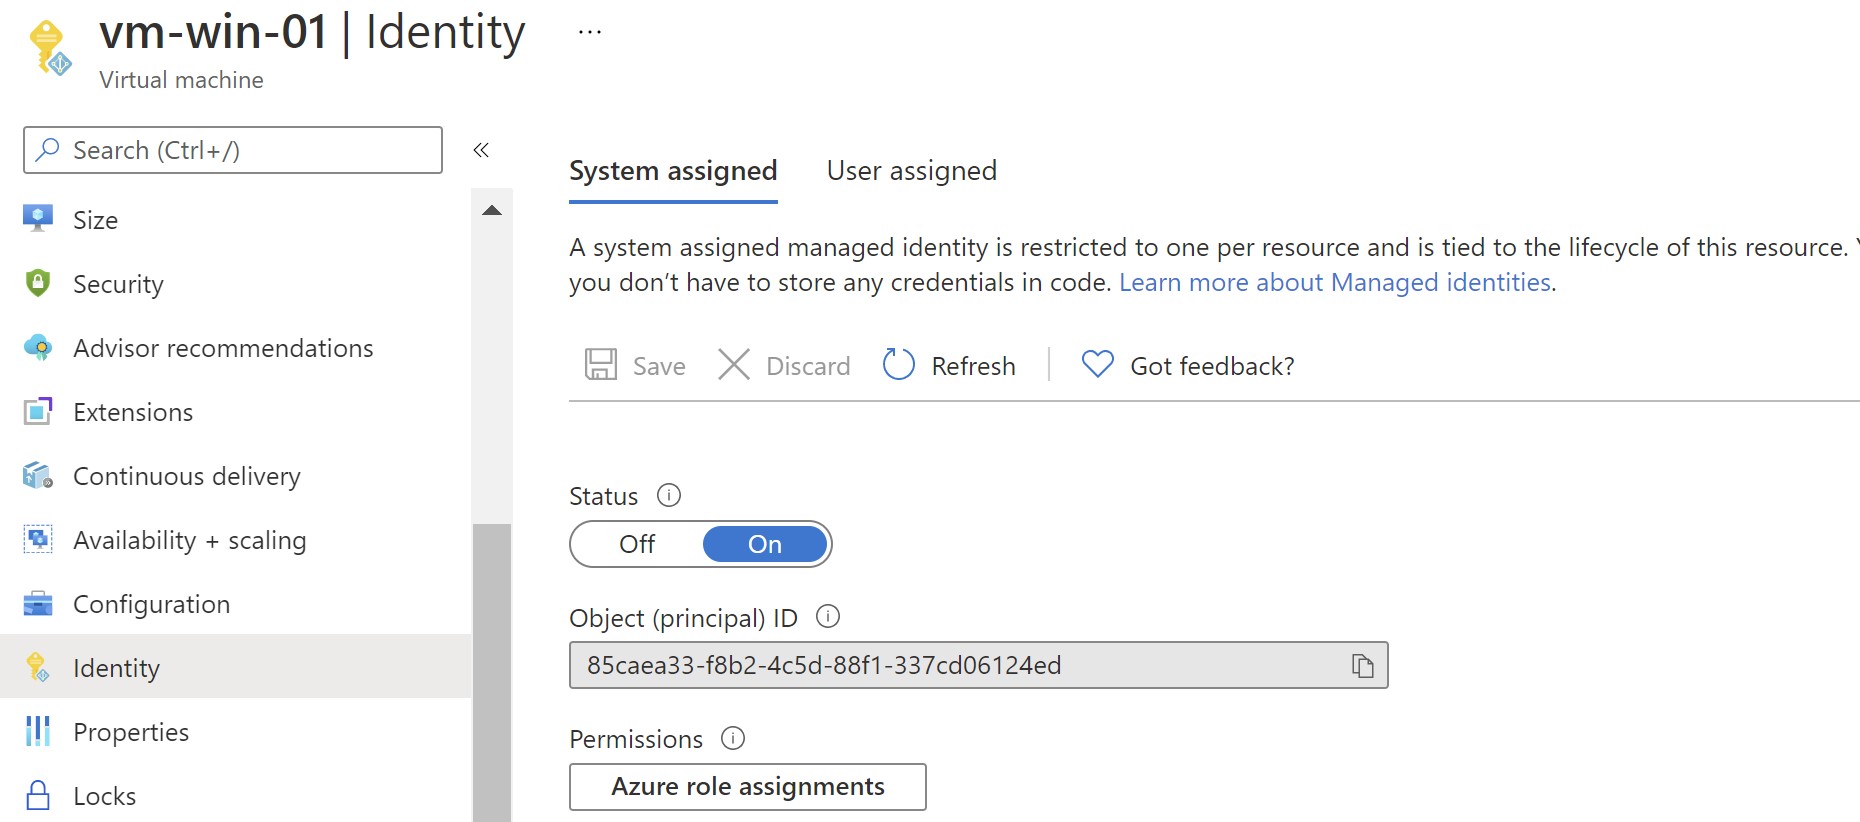
System-managed identity is enabled on the VM
⚠️ Note: If you already have a user-assigned identity to this VM ,unless specified in the request, the machine will default to using System Assigned Identity for all other apps.
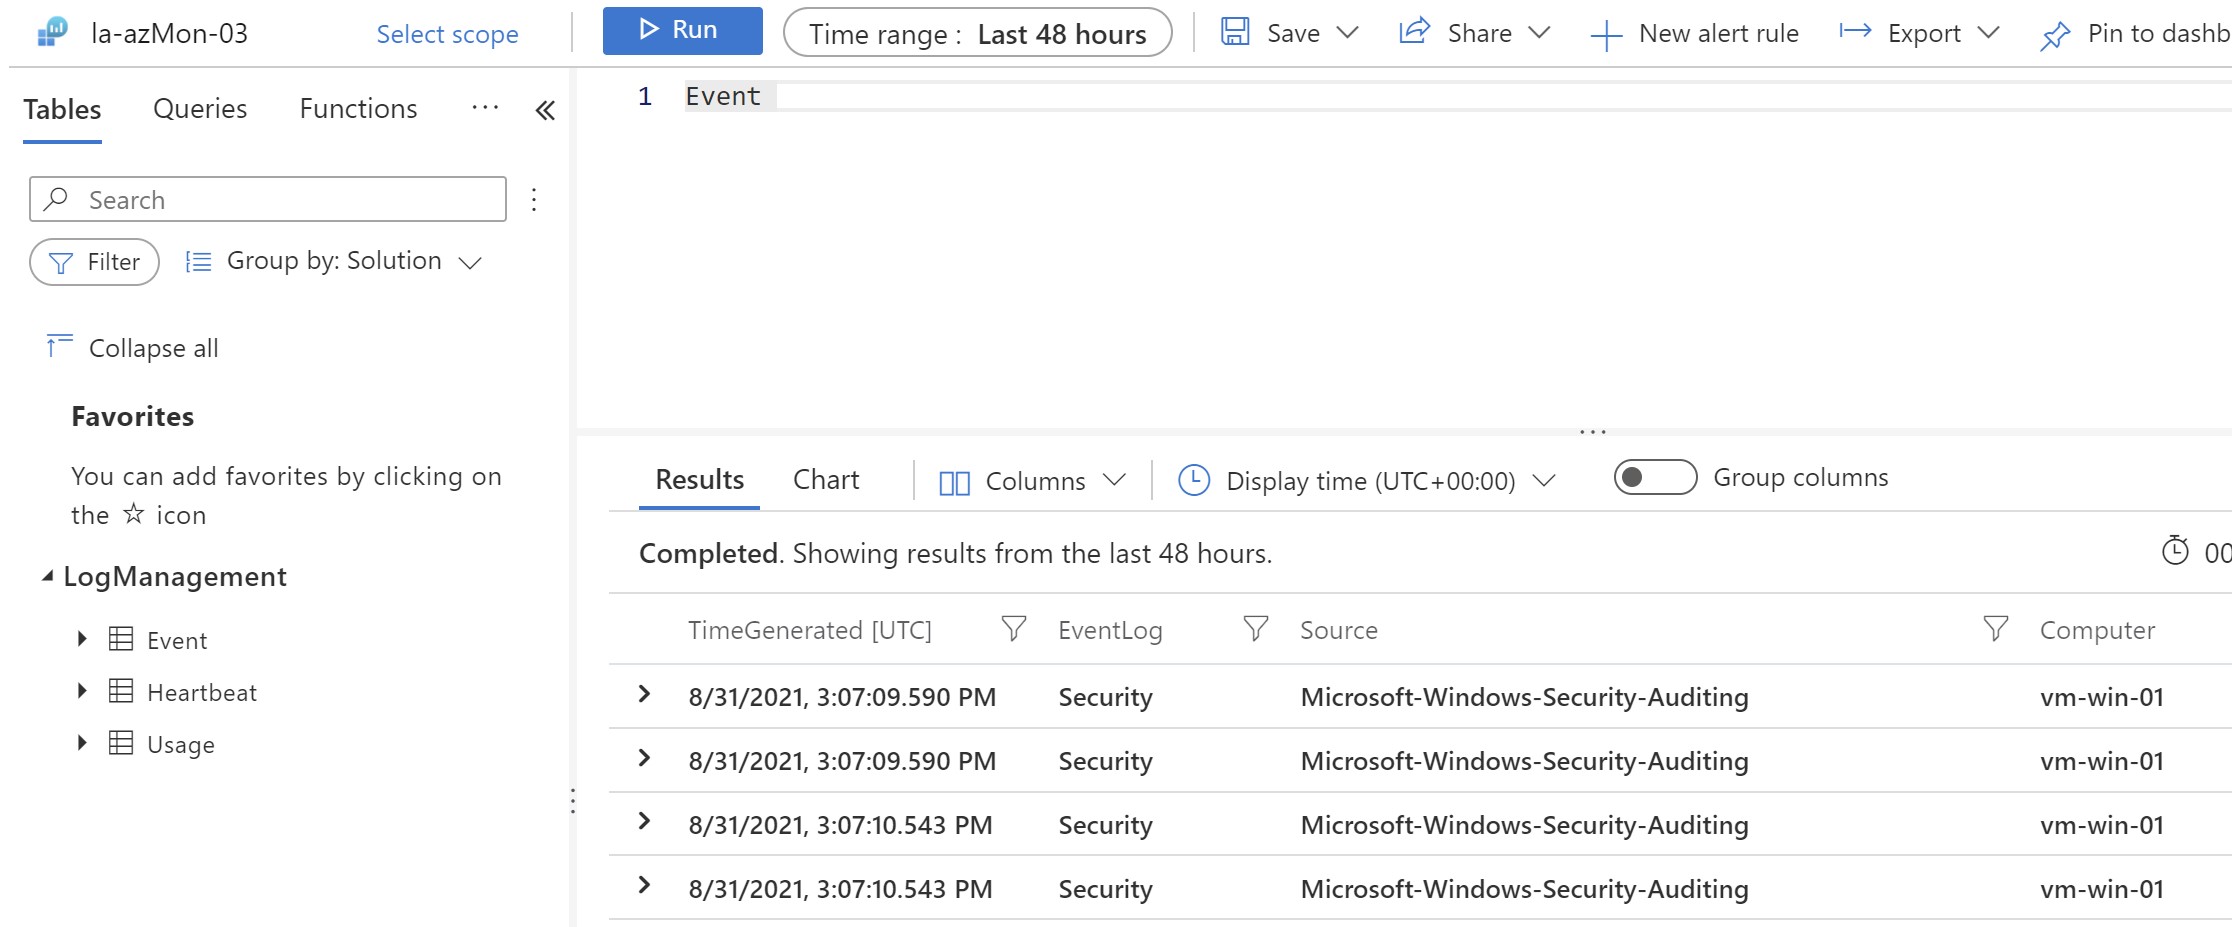
The VM is reporting to the two log analytics workspaces configured in the DCR
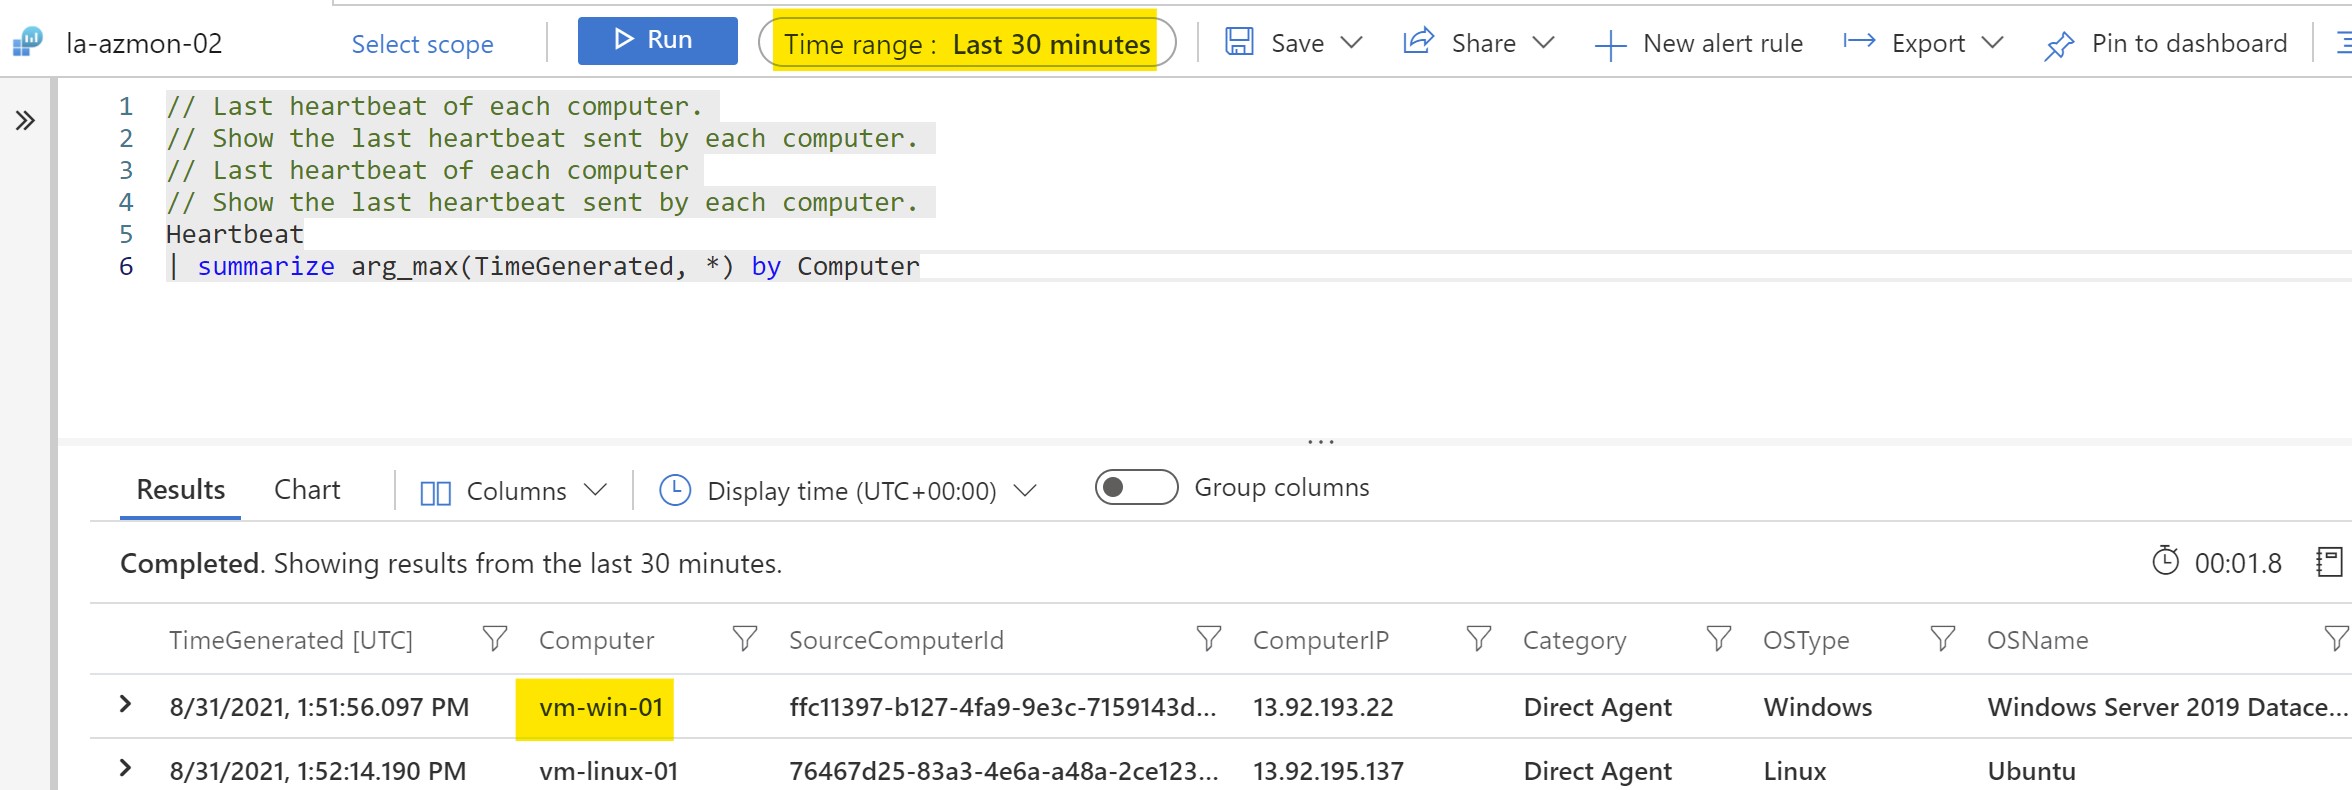
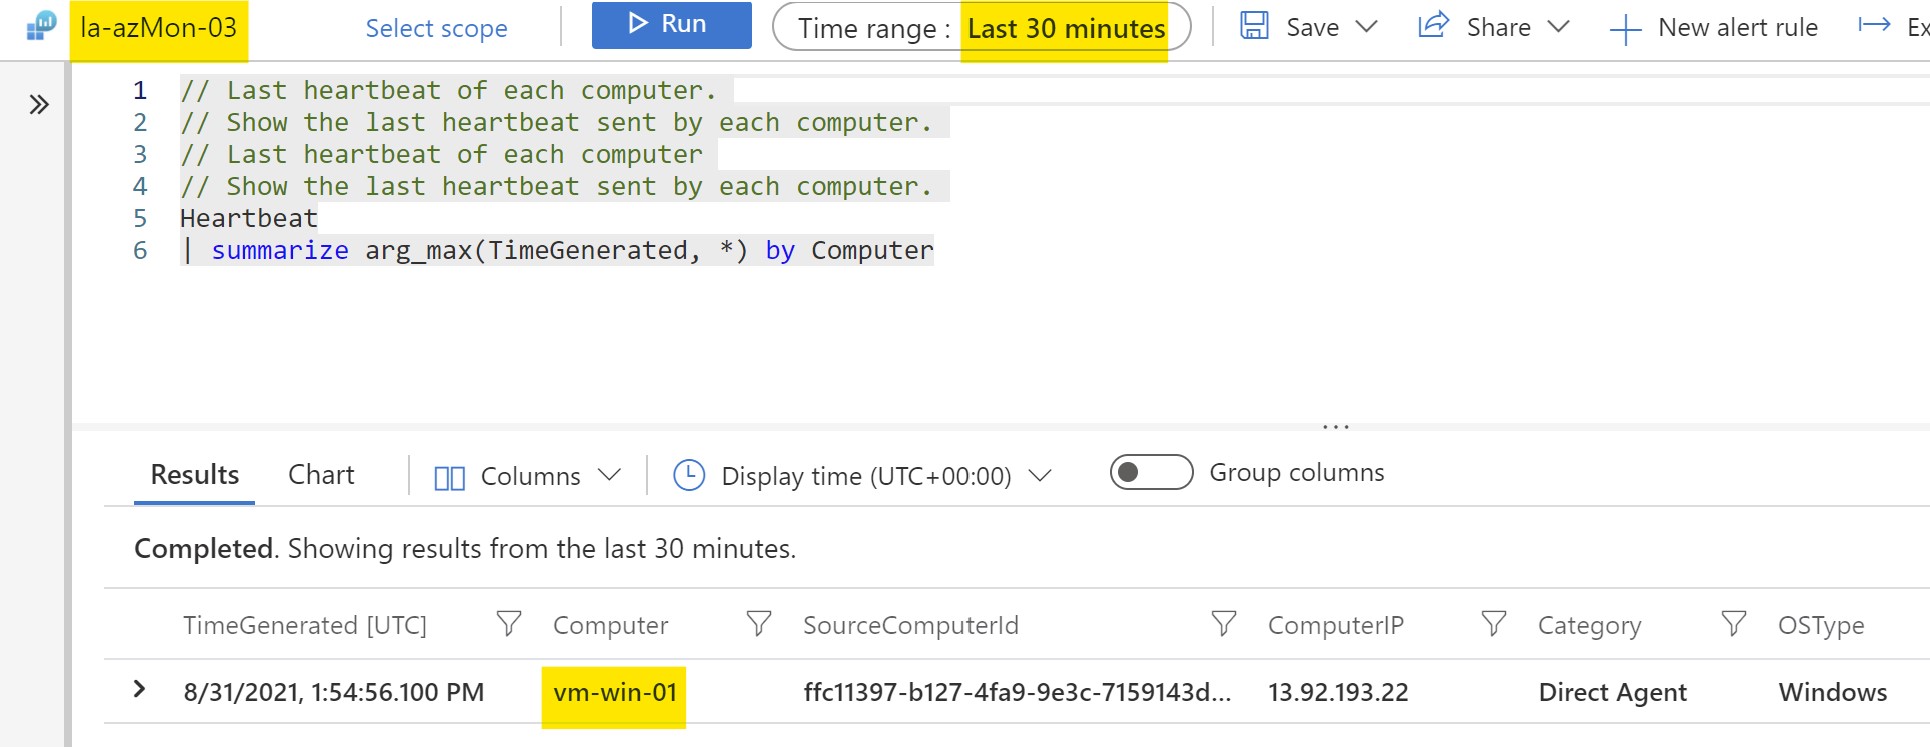
After waiting for some time for the VM to start sending data apart from Heartbeat ,we can see now the log data is being sent to the new workspace
Finally ,i can safely remove all the other monitoring extensions available on the VM using the portal/CLI/Powershell.
⚠️ While you can use both agents in-parallel, this can duplicate costs ,storage and performance.
Get-AzVMExtension -ResourceGroupName "rg-azmon-01" -Name "MicrosoftMonitoringAgent" -VMName "vm-win-01" | Remove-AzVMExtension -Force -Confirm:$false
2.Mass Deployment using Azure Policy
In this method ,i will use Azure Policy to demonstrate how to do mass deployments for existing and new VMs.
⚠️ The difference between the portal method and this one is that the system-assigned managed identity will not get created automatically ; so you need to have it enabled first to be abe to authenticate with log analytics.
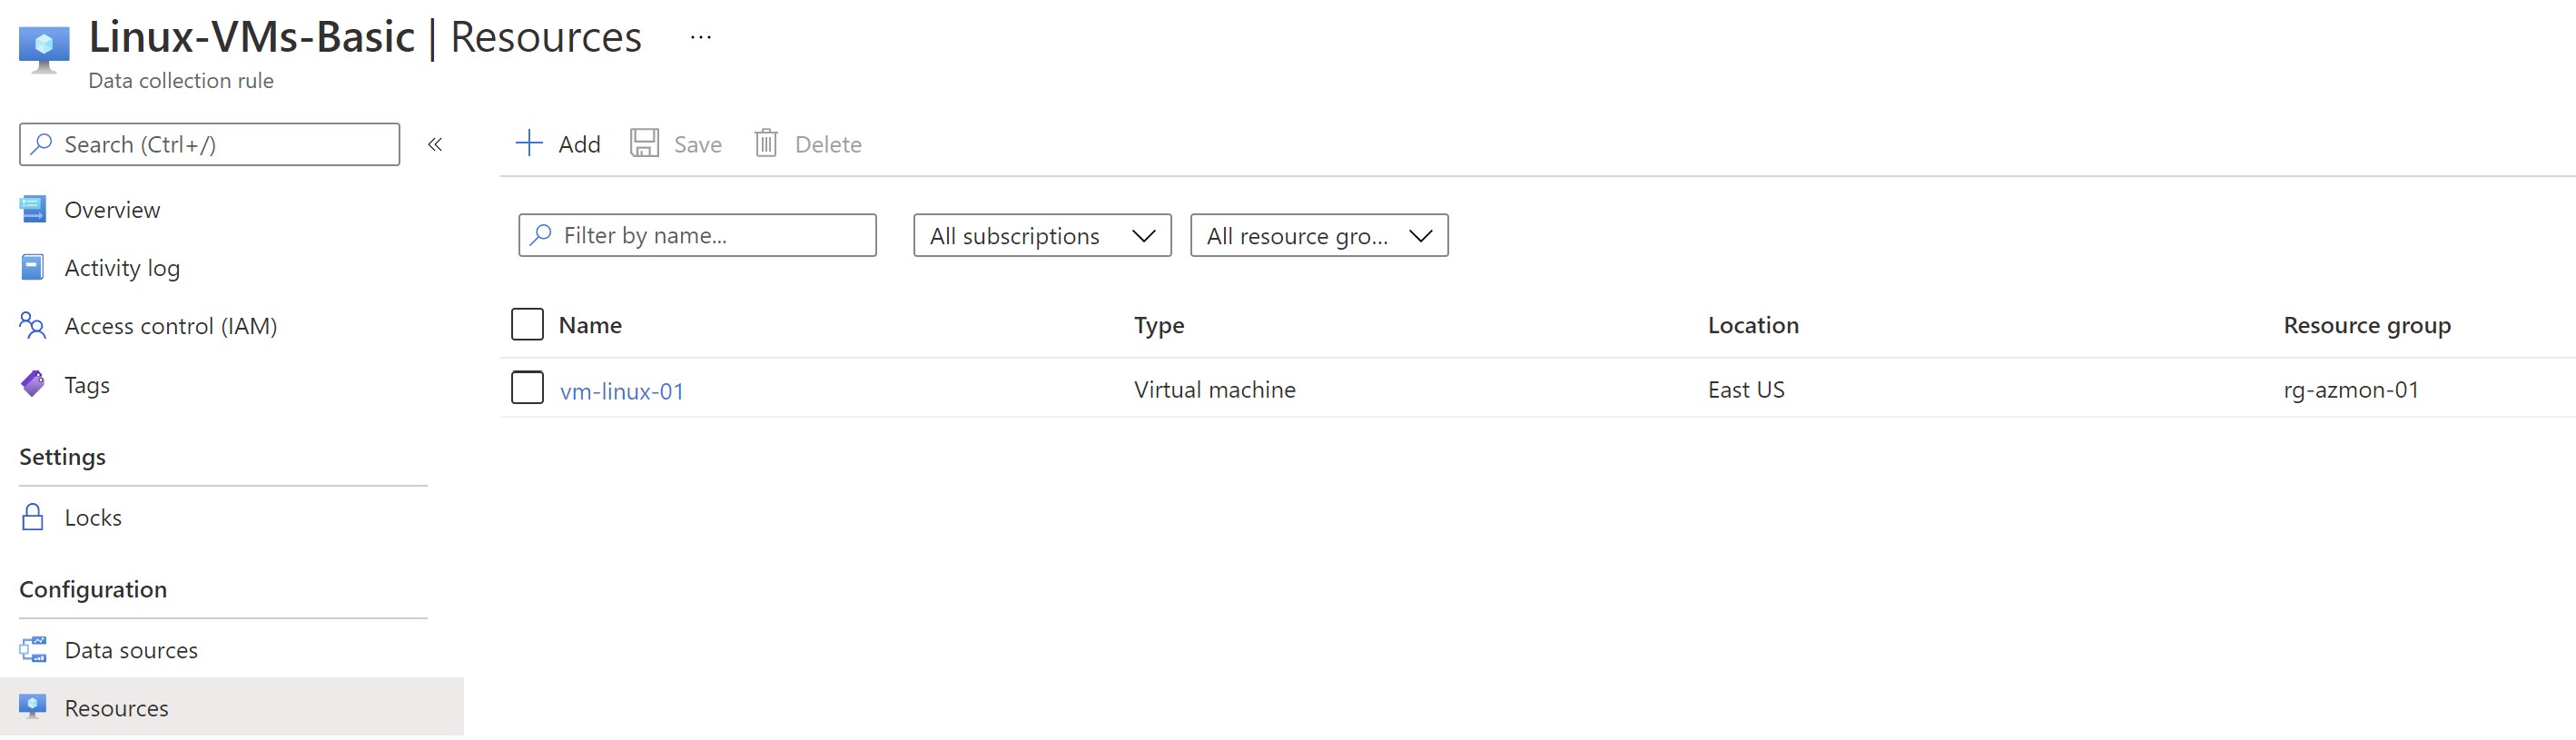
This time i will create a new DCR for Linux and will not add any VMs to it.
We need to get the DCR resource ID to use it later with the policy
Going to Azure policy and filtering by “Monitoring” ,we get two initiatives for configure the agent and associating the DCR.
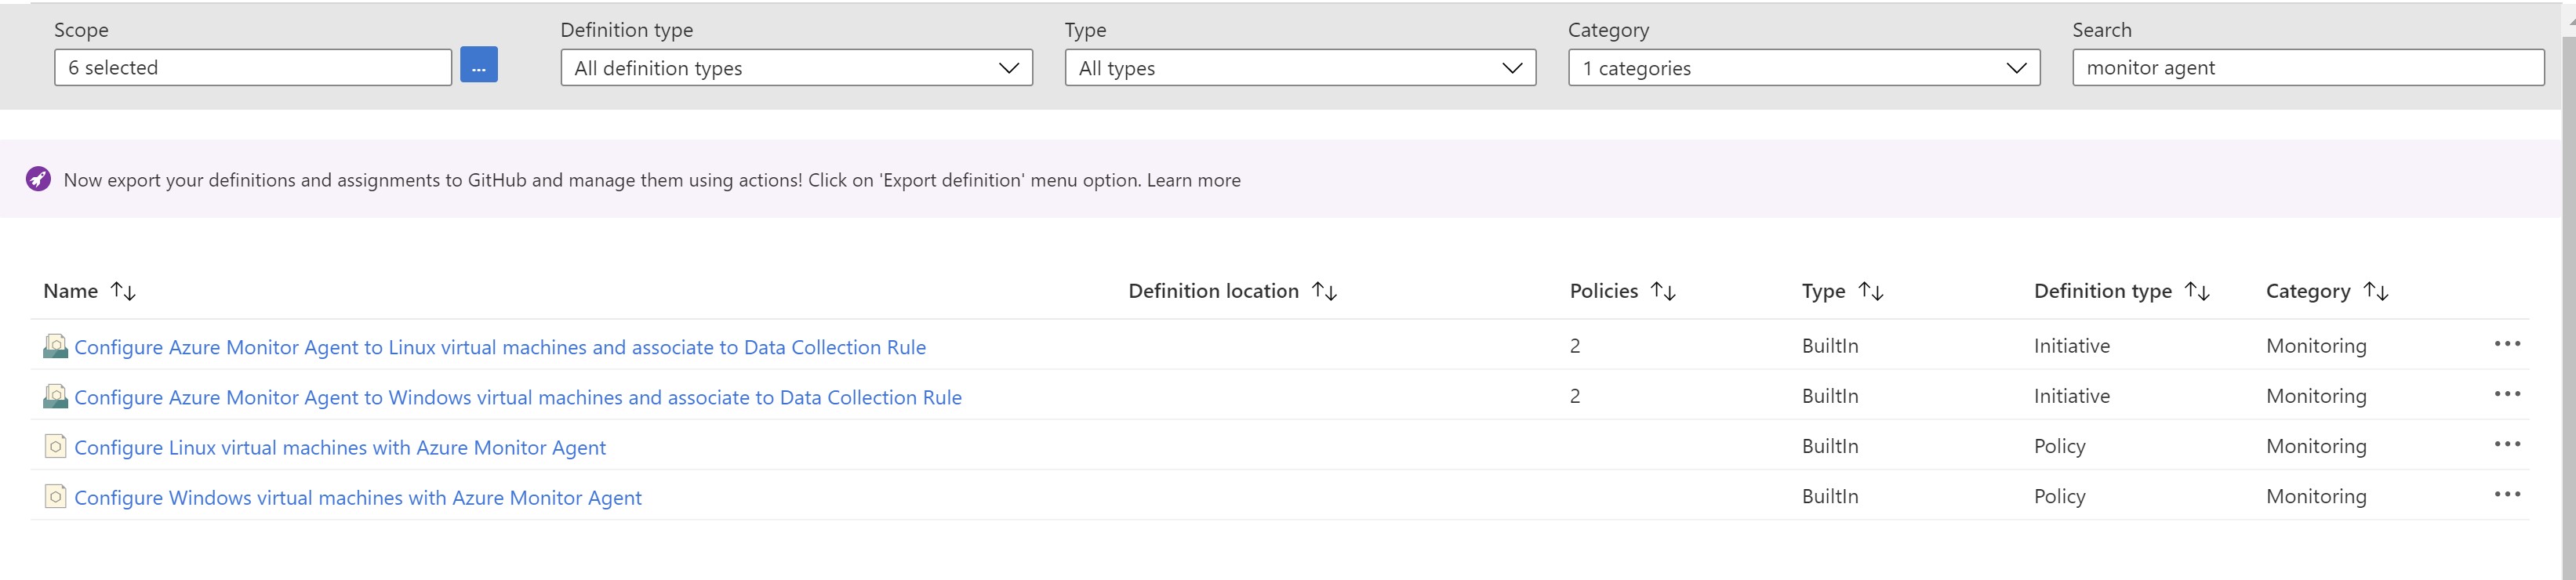
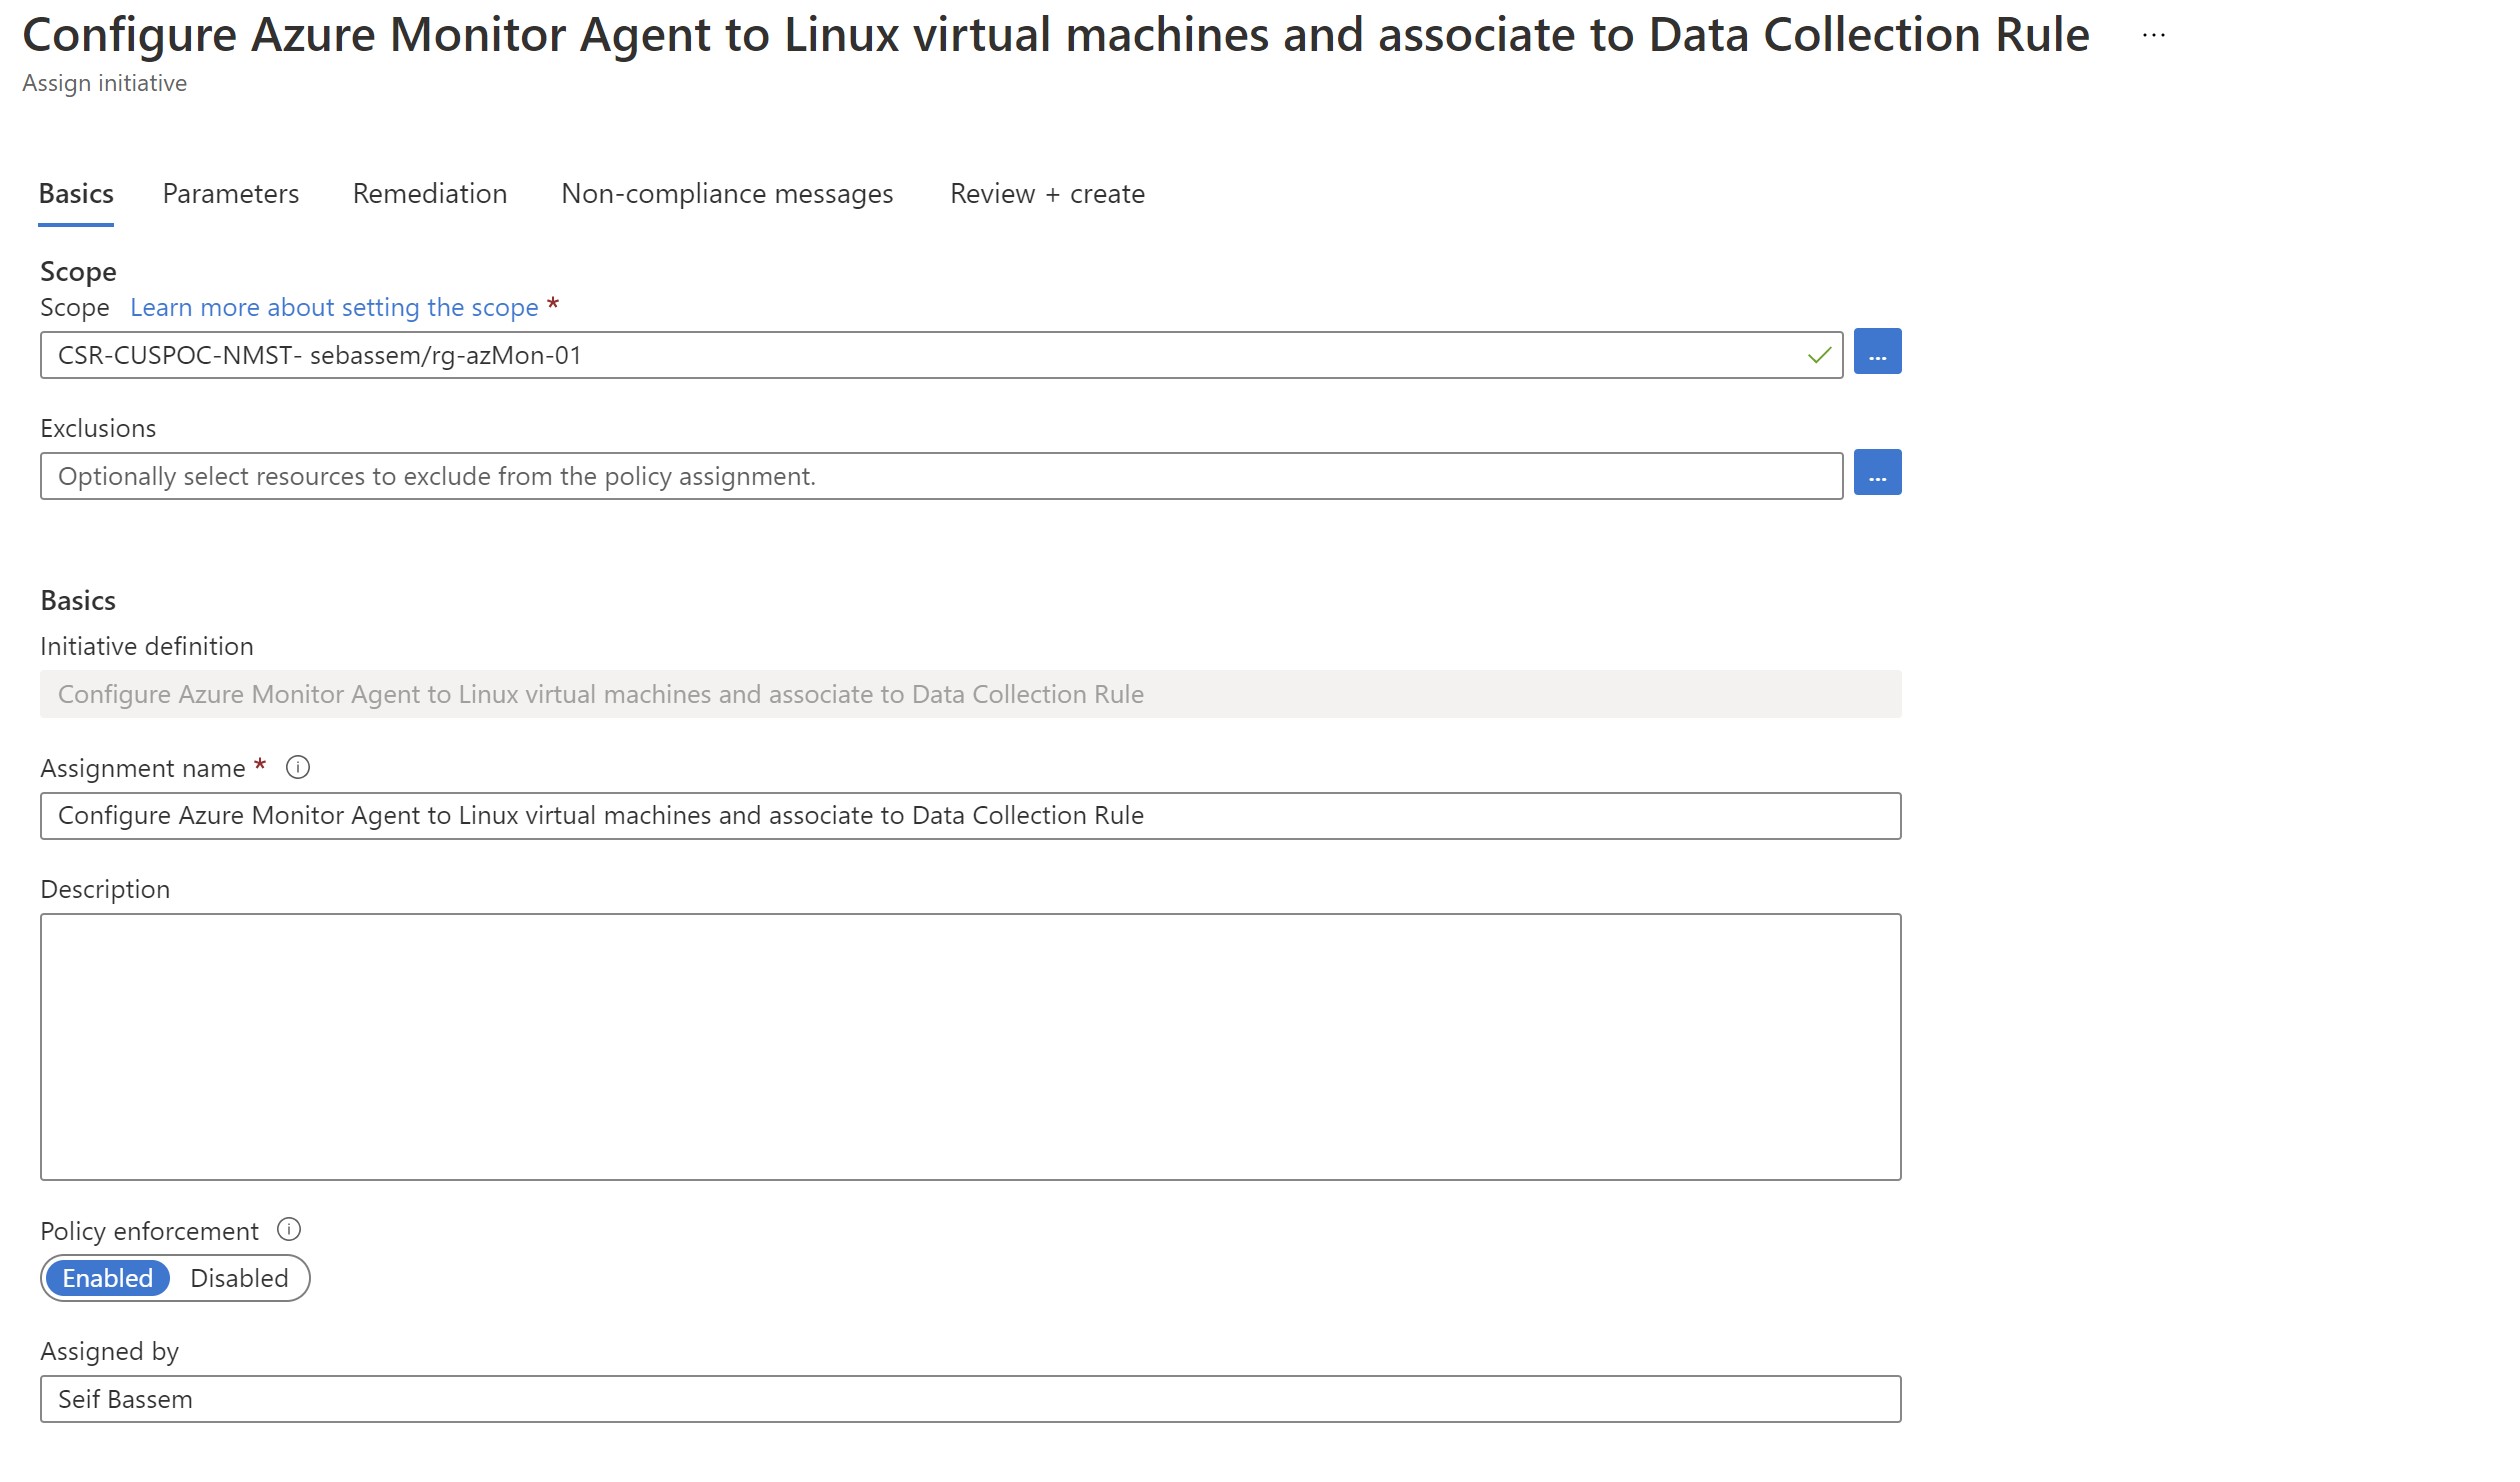
Assign the initiative targeting linux to our resource group
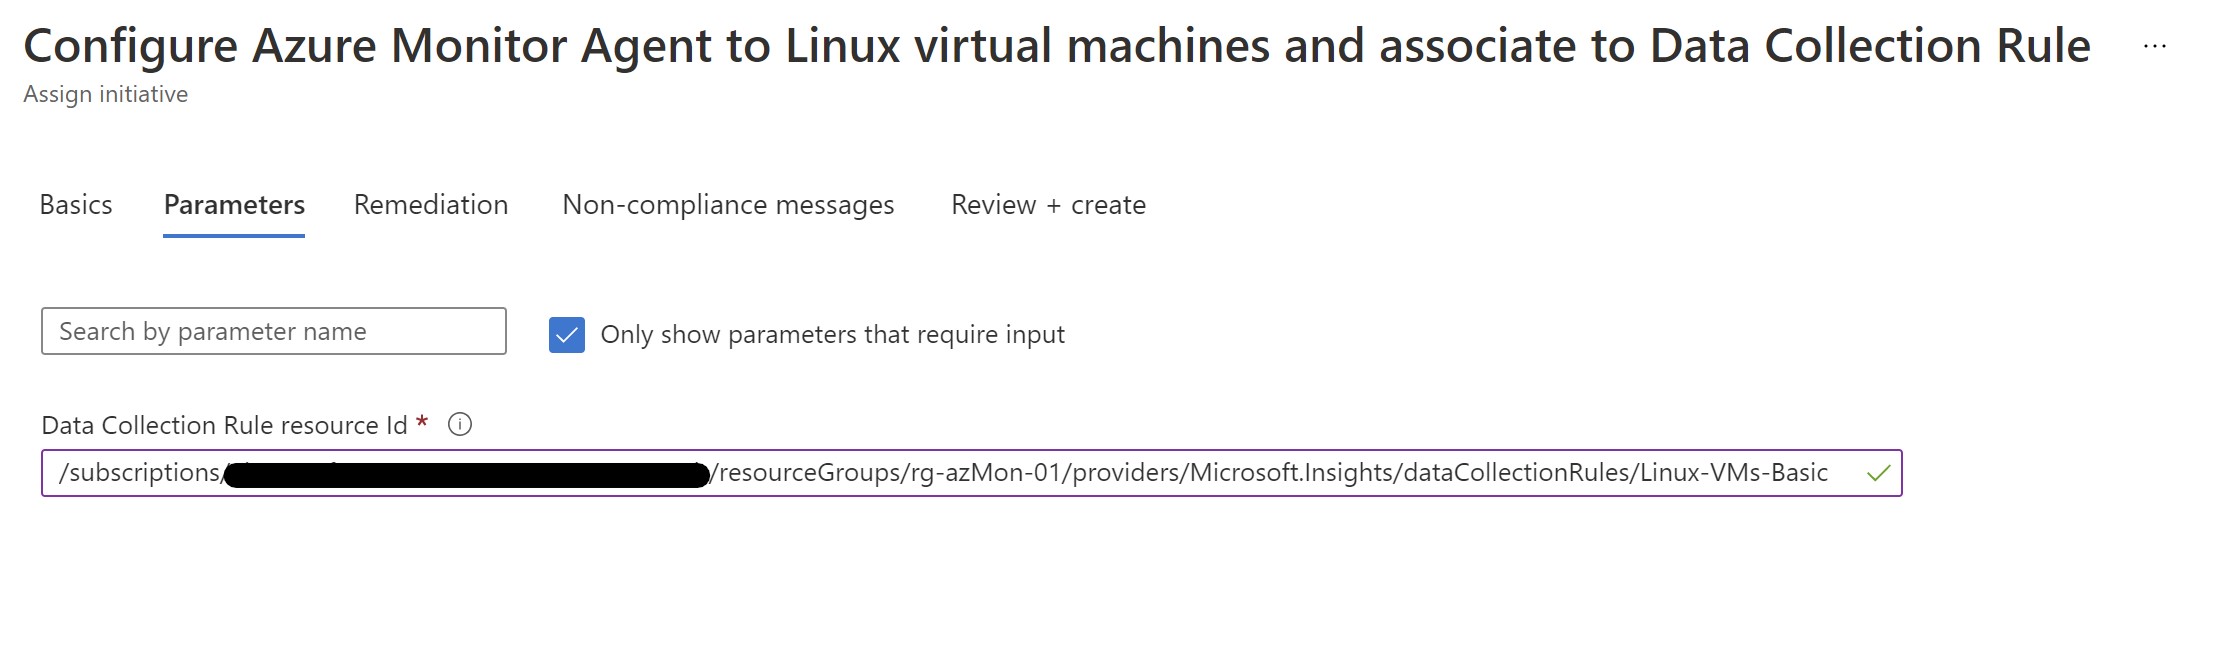
Provide the DCR resource ID to associate with our linux VM
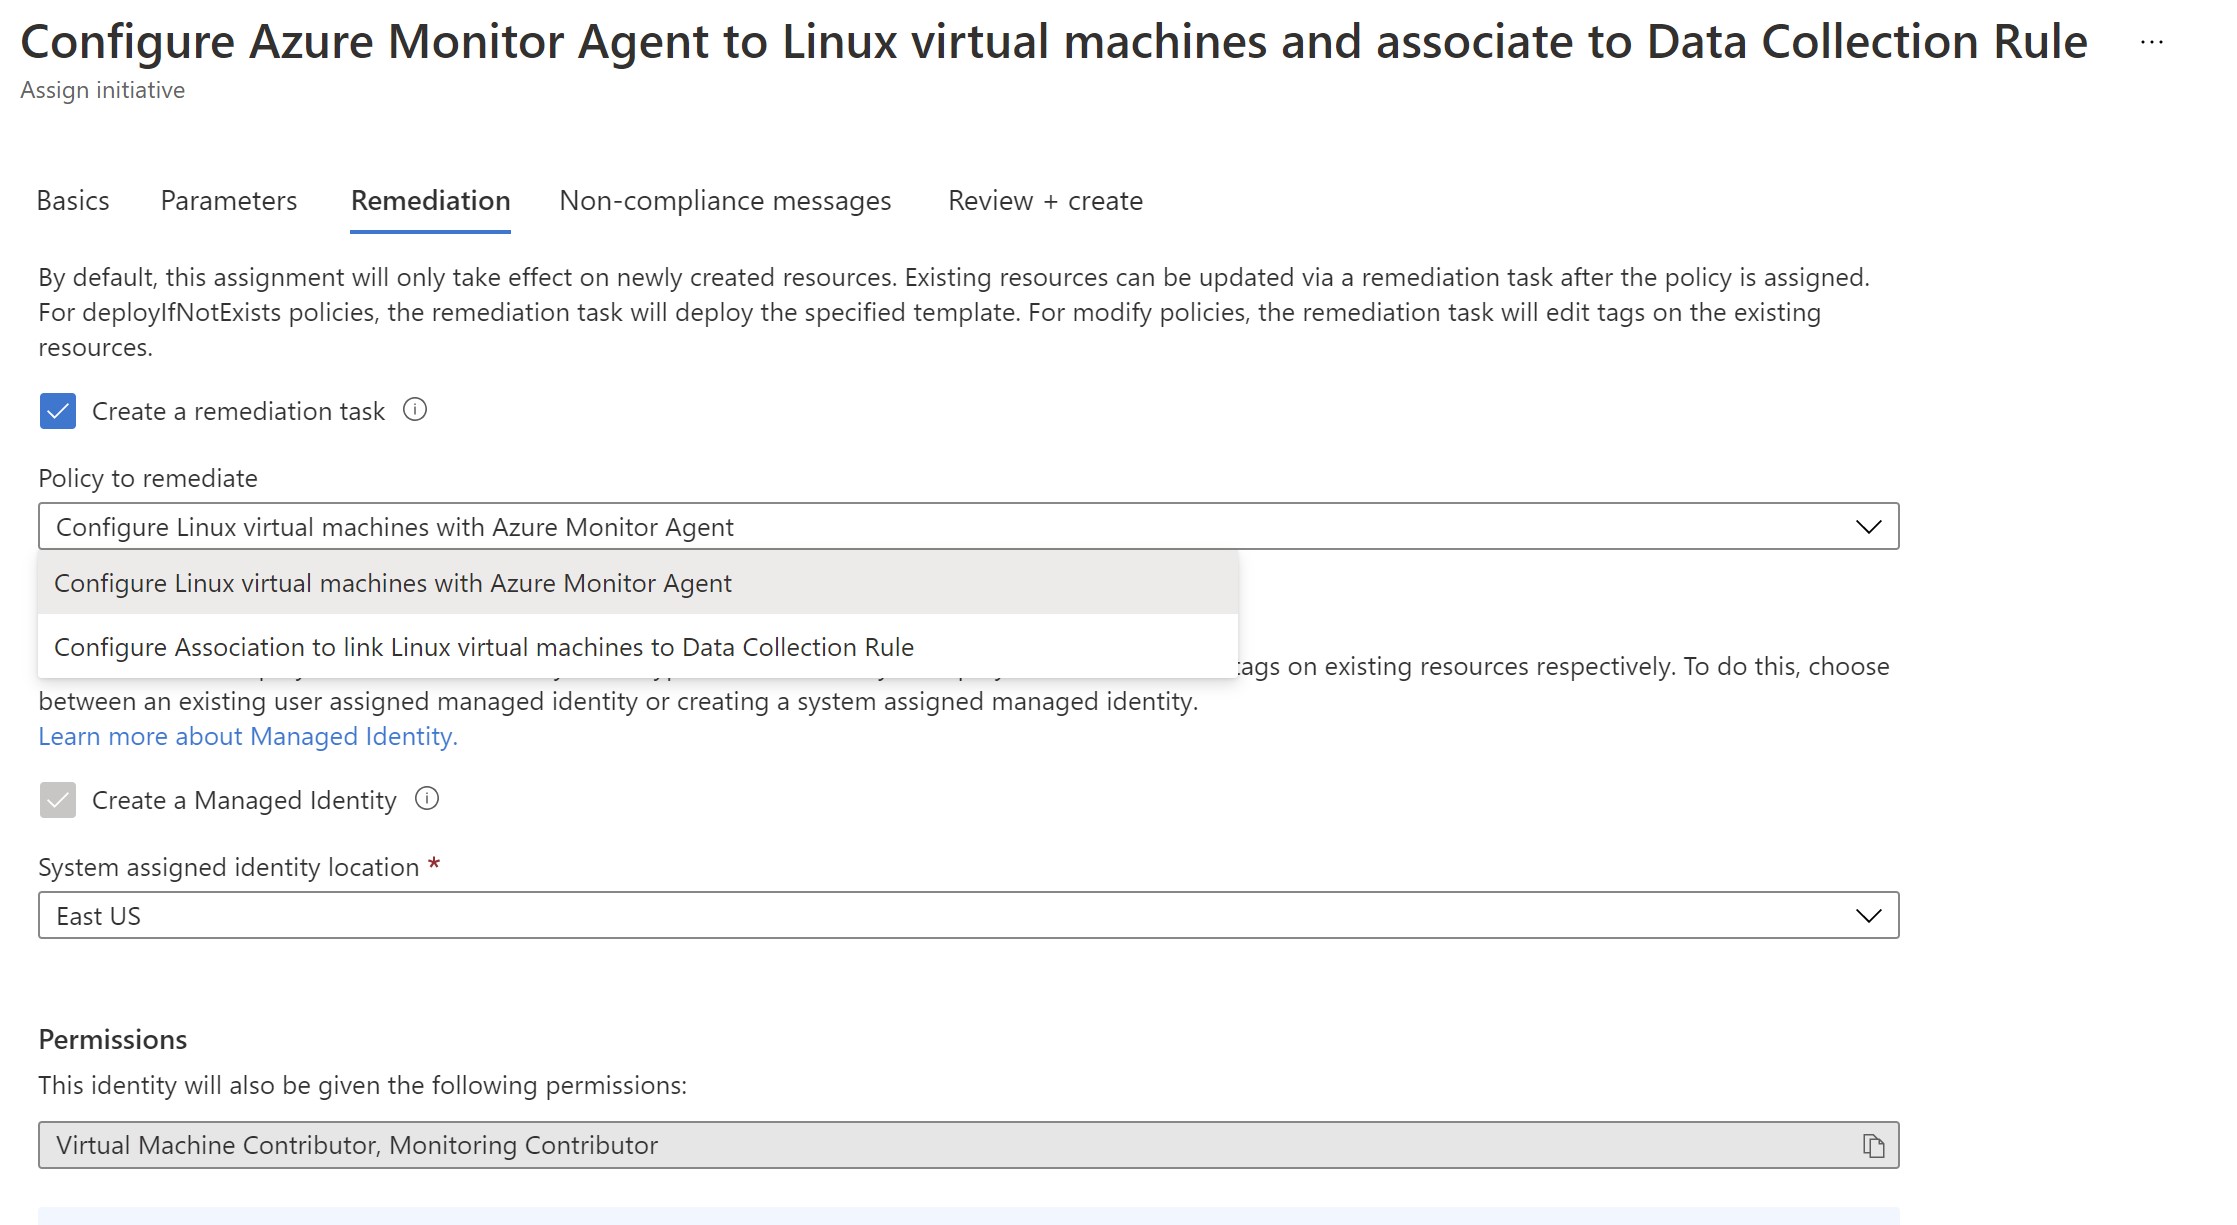
Select to create a remediation task as our VM is already deployed
Now ,we wait for 5-10 minutes for the Azure policy to start evaluating and the remediation tasks get started .
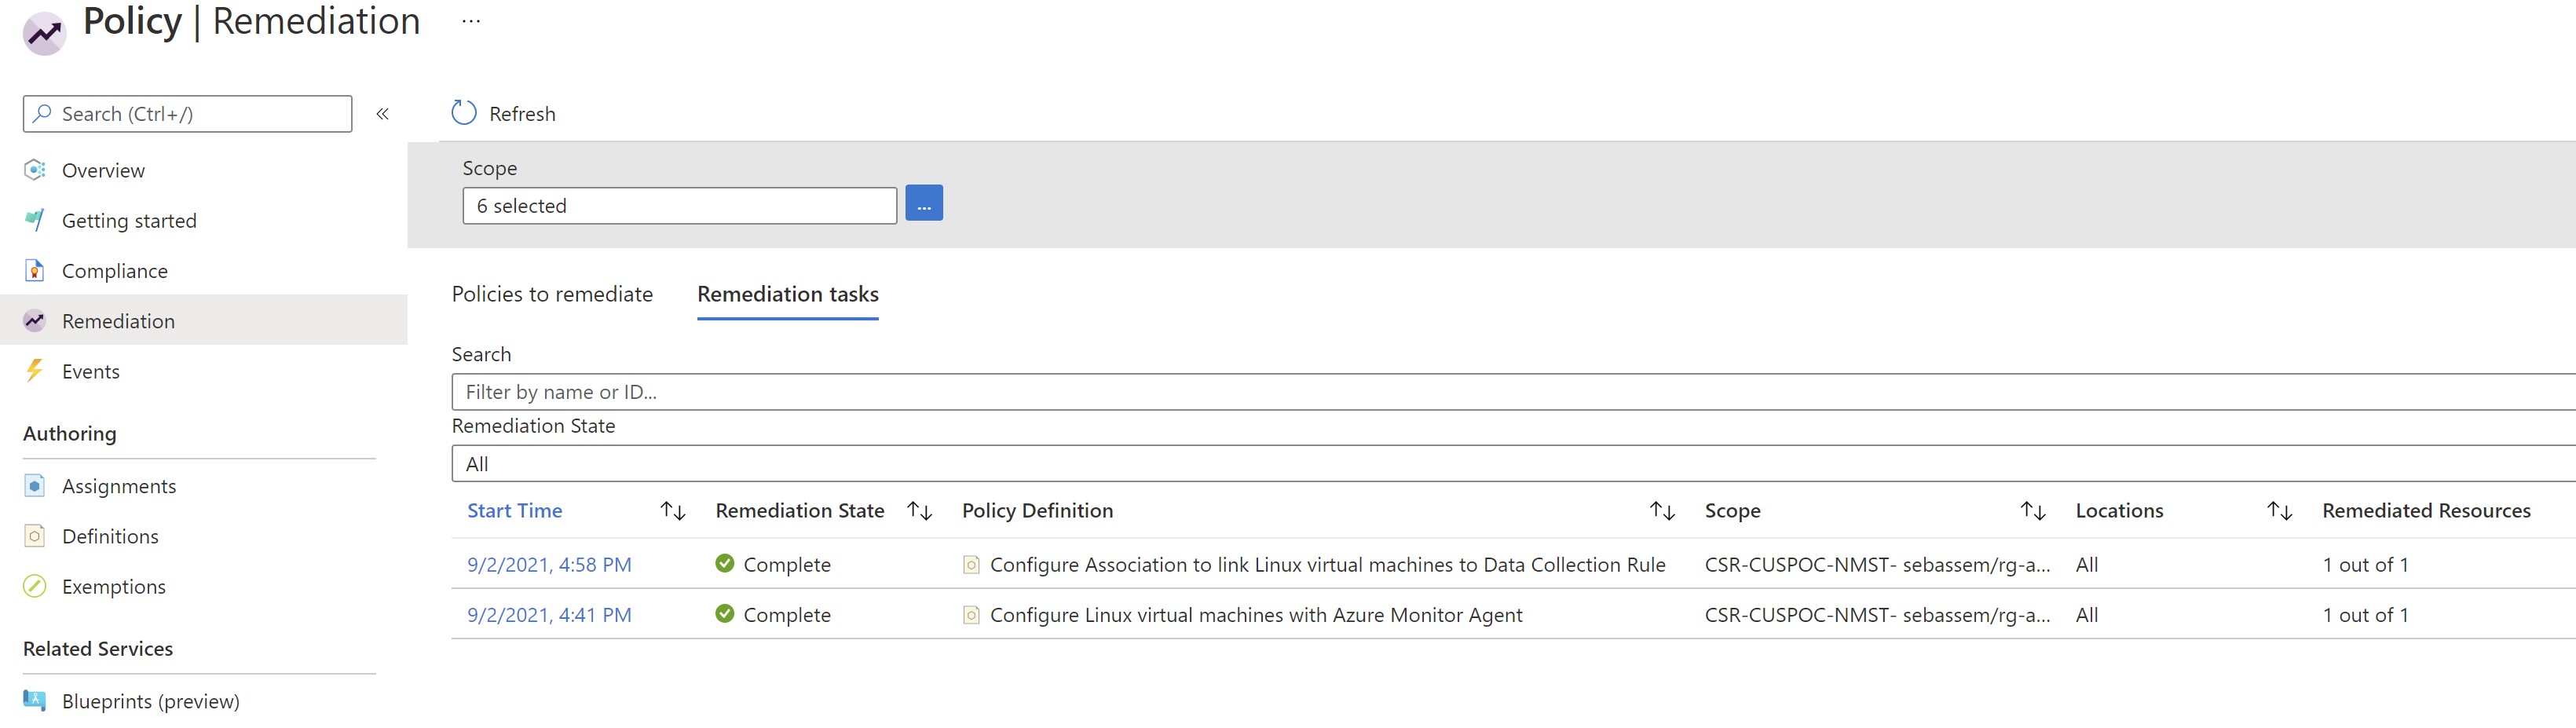
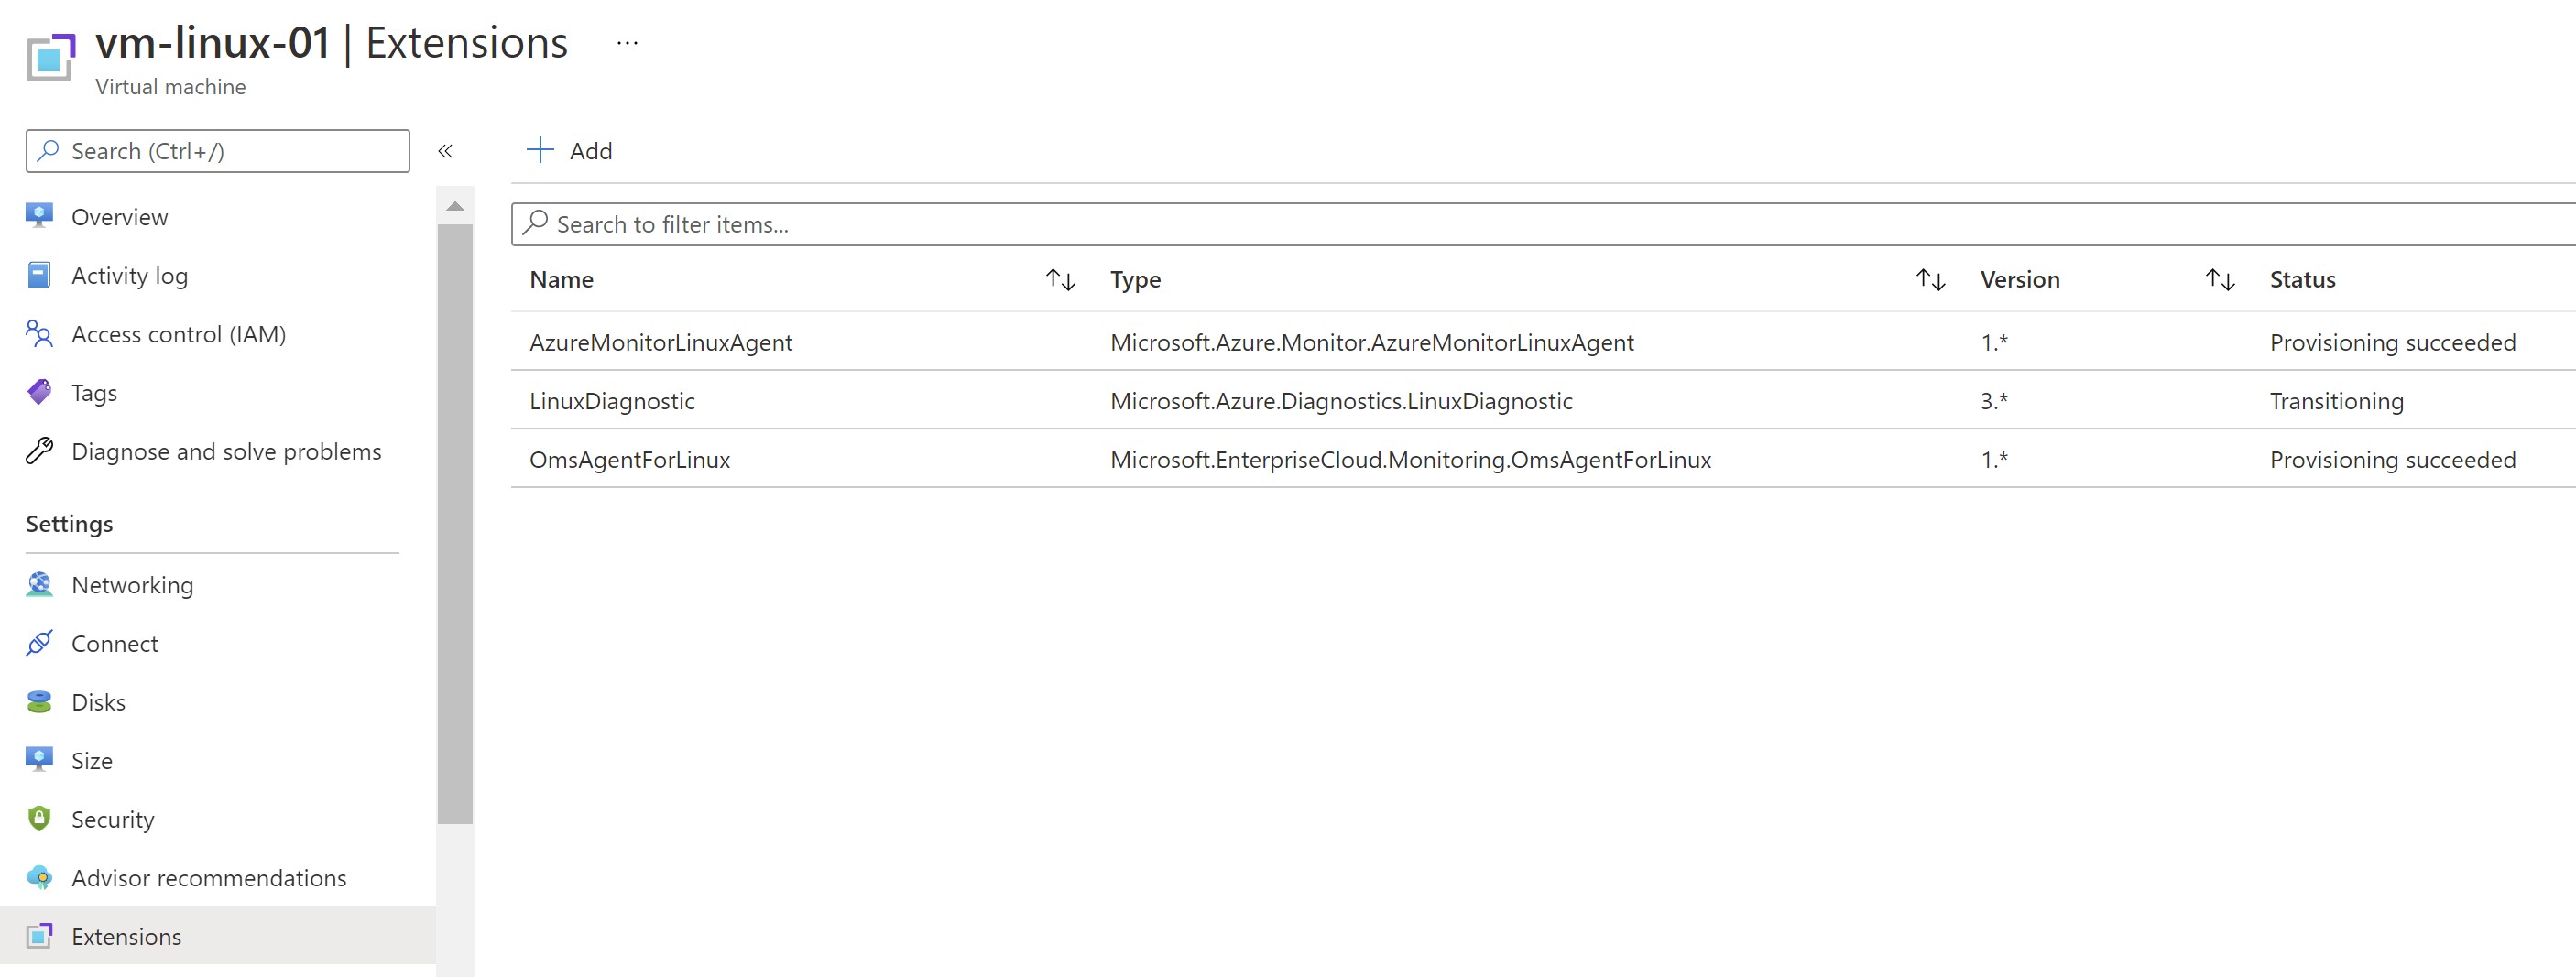
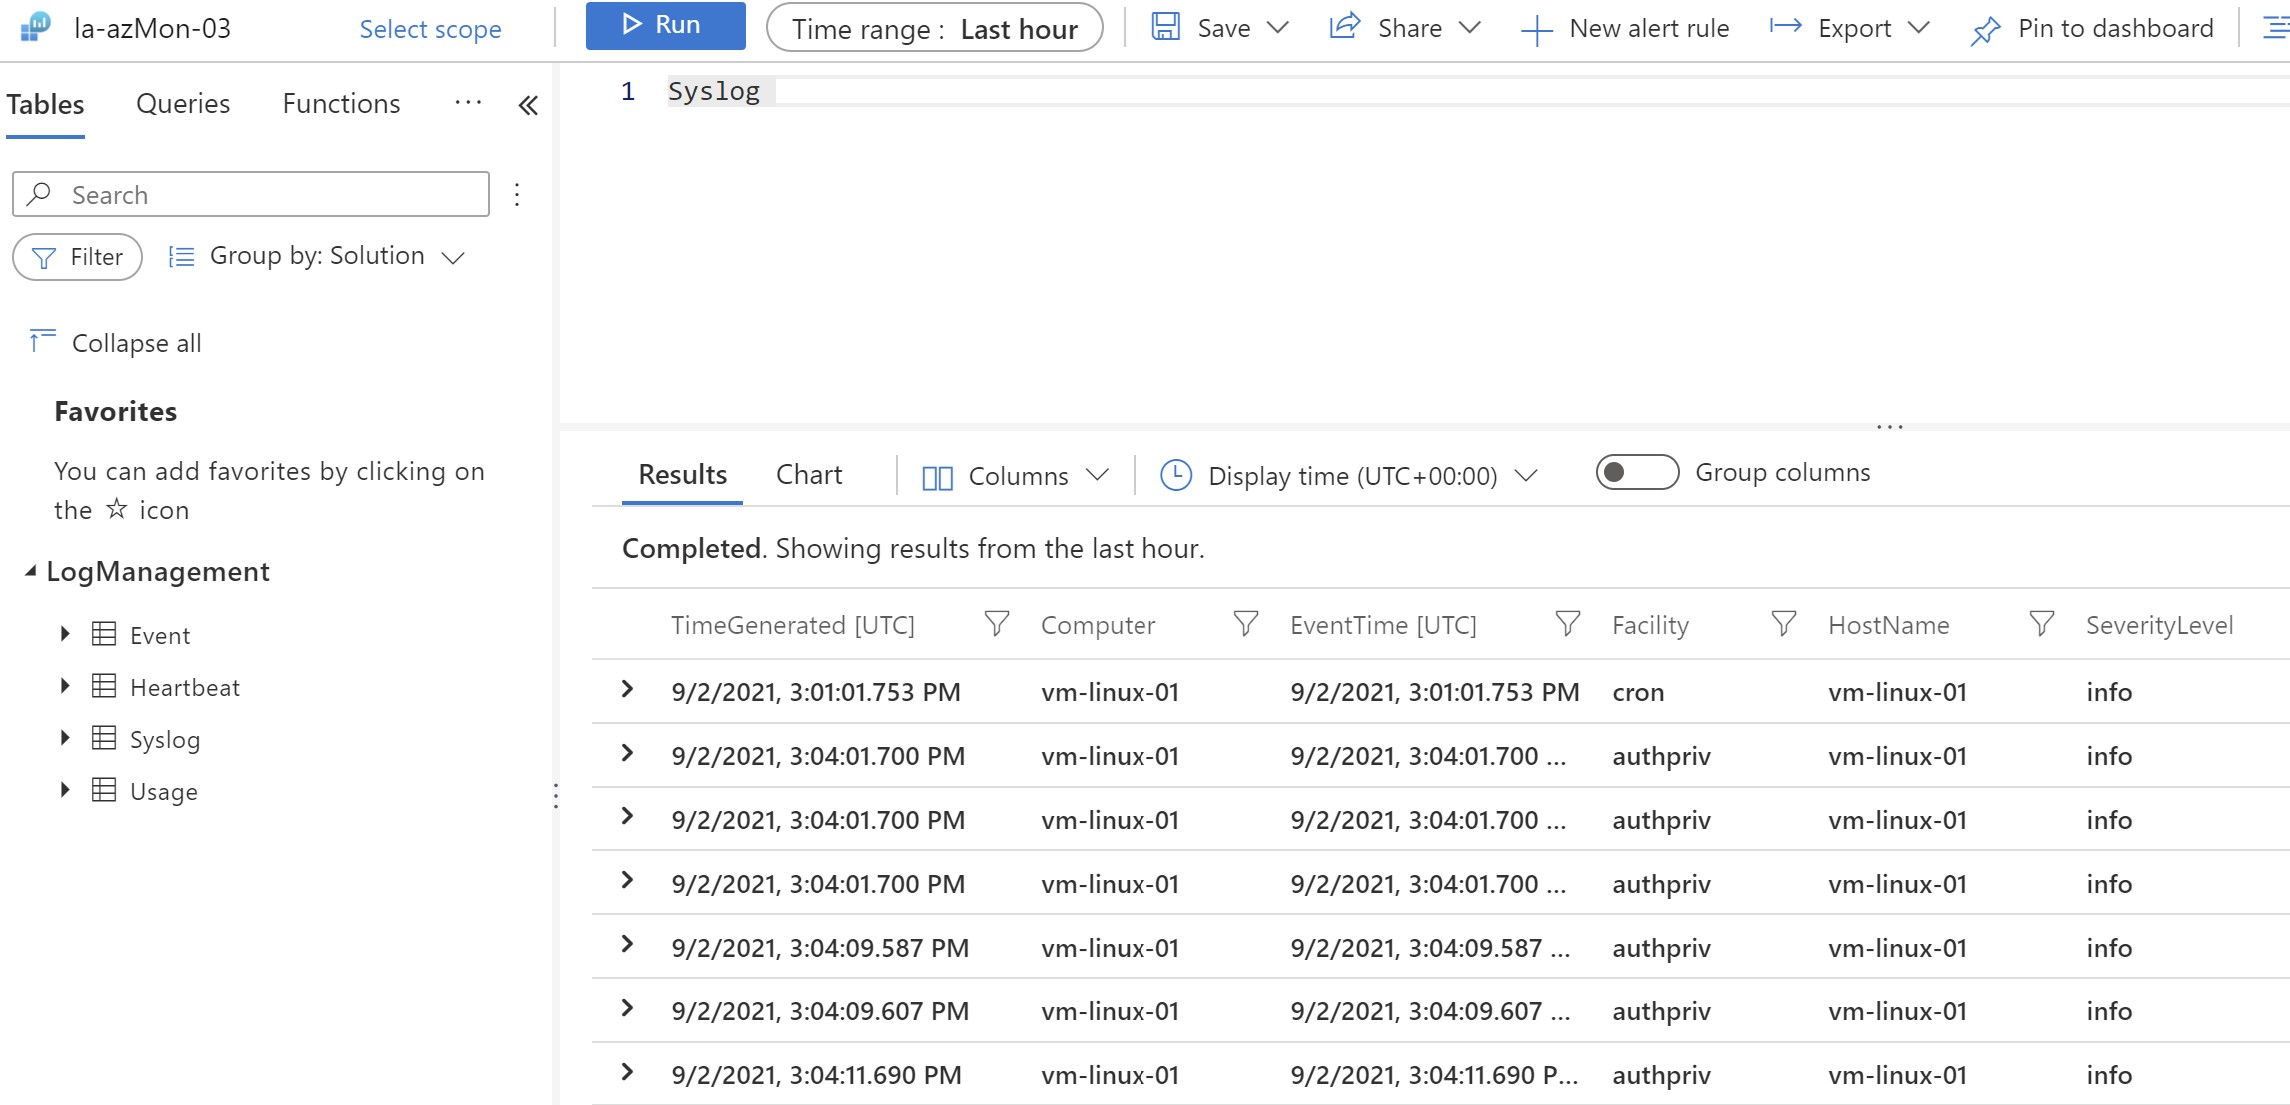
We can see now that the agent has been deployed to our VM , the VM gets associated with our linux DCR and it’s already reporting to log analytics.
Recap
The introduction of the Azure Monitor agent to replace other agents is a welcomed addition ,at the moment it’s still missing some of the existing capabilities of the other agents but it should get new features along the way. There should be enough time before the other agents get deprecated so my advice is to validate your current monitoring needs and if the new agent provides all what you need ,consider migrating to it ,otherwise it’s better to wait with the current setup.
📹ITOpsTalk: Azure Monitor Agent
📹Microsoft Azure Monitor Agent and Data Collection Rule Overview

My name is
Seif Bassem
You May Also Like

Azure Monitor workbooks - Your interactive monitoring canvas
Azure Monitor Workbooks Workbooks are one of my favorite services on …
Deploy Azure App Services anywhere using Azure Arc
At the date of this post, Azure has 60+ regions around the world where …
Azure Migrate - Modernize your applications during migration
Overview It was recently announced that the Azure Migrate program has …