Azure Monitor workbooks - Your interactive monitoring canvas
Azure Monitor Workbooks
Workbooks are one of my favorite services on Azure , it’s a canvas that you can customize to display visual and interactive information about your Azure environment. It allows you to query various sources of data in Azure , modify/process the data if needed , then choose to display it using any of the available visualizations and finally share the workbook with your team so every one can use it.
You might think , how is this different than dashboards ?!!! Let’s explore workbooks in more details in this post.
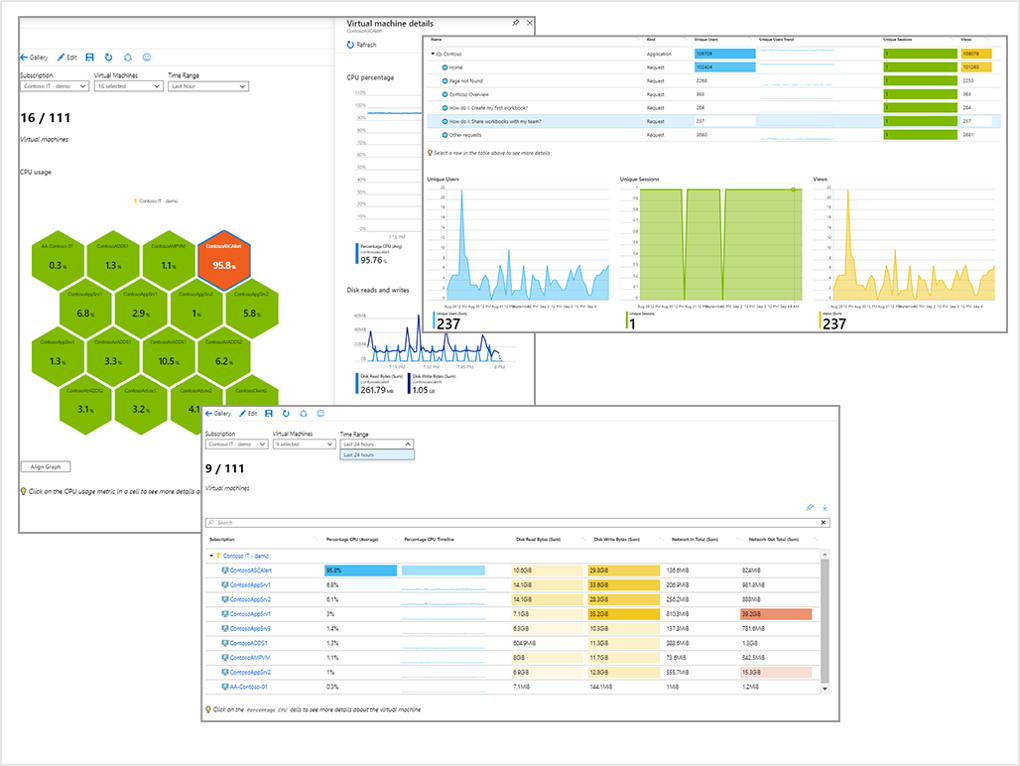
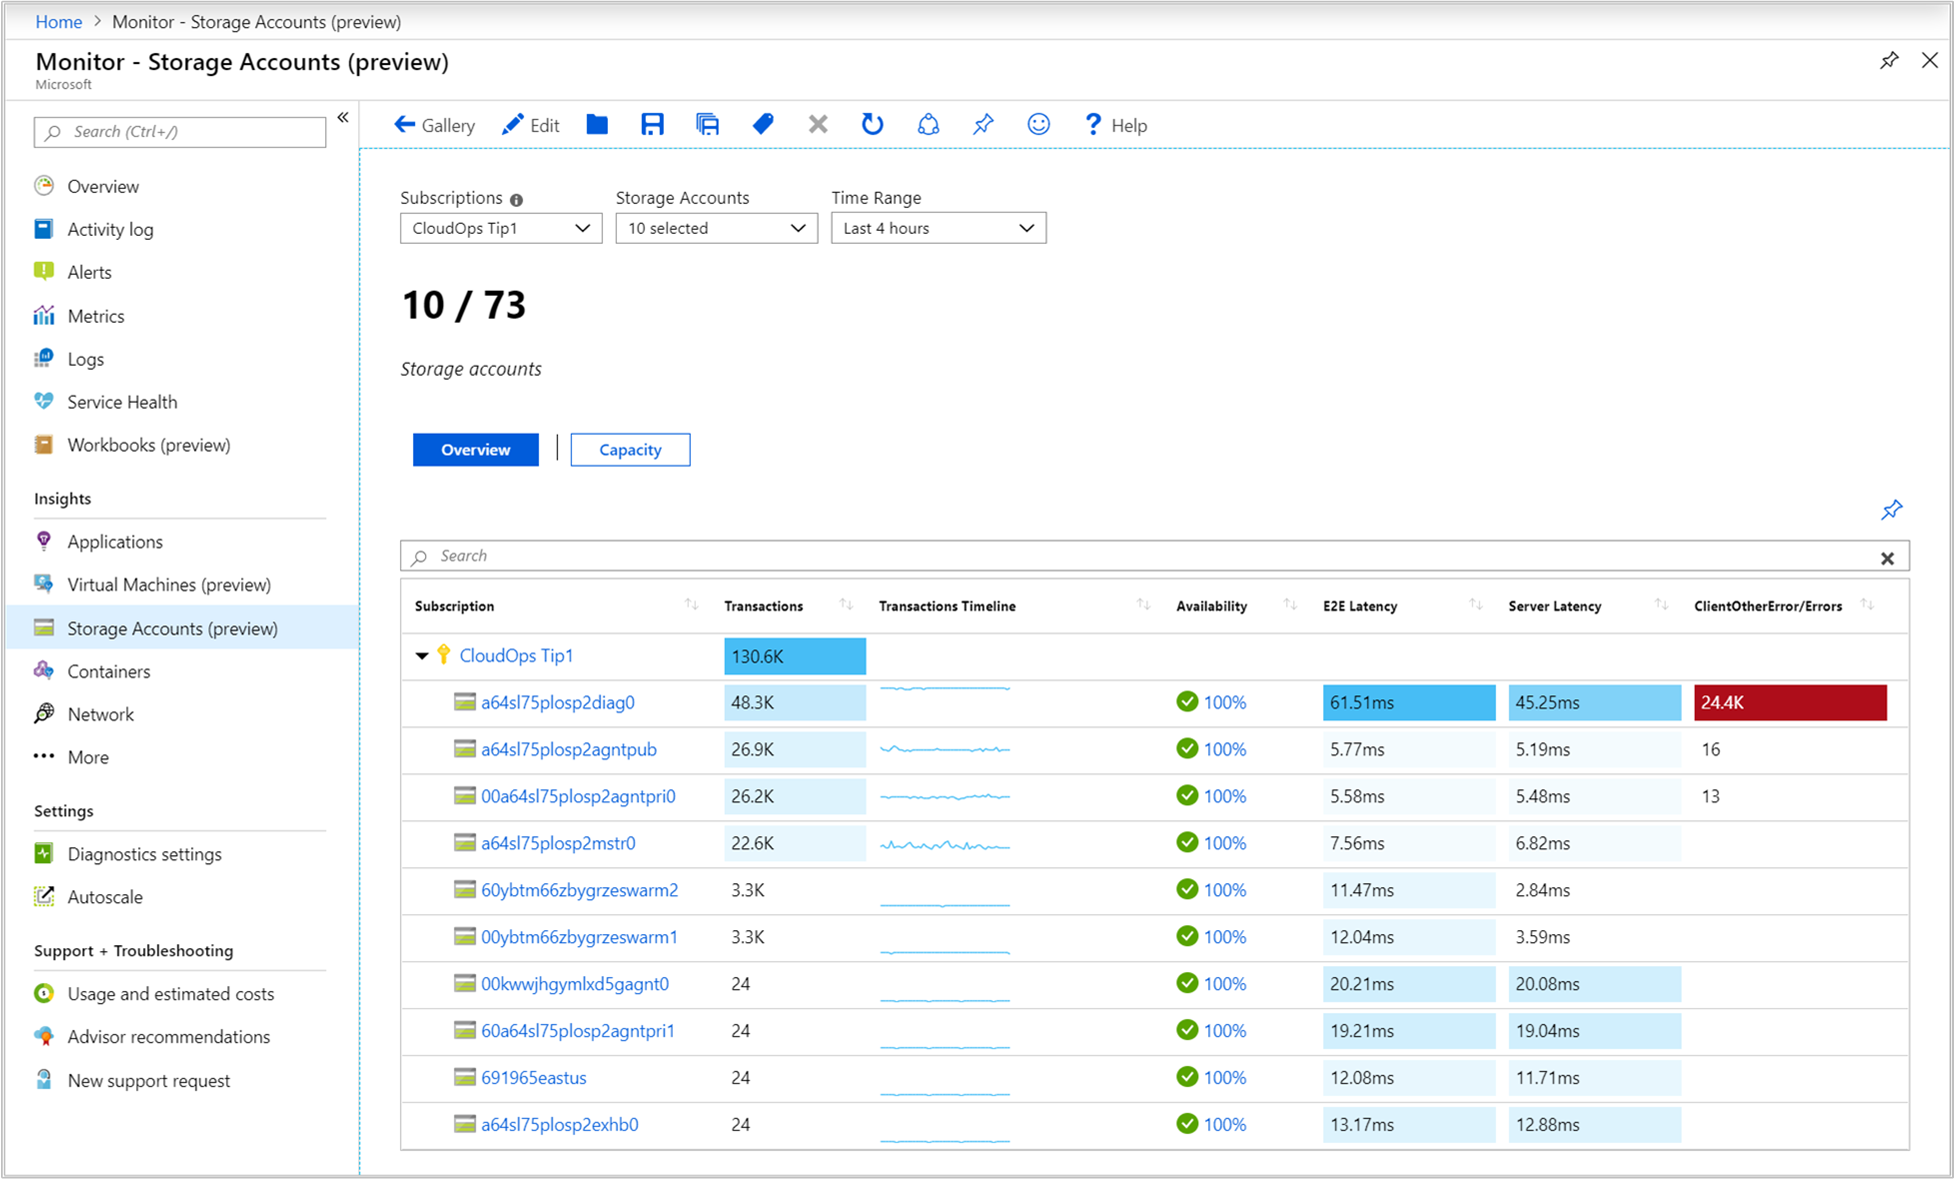
If you have already used the insights feature in Azure Monitor for virtual machines or storage accounts or any other supported service then you have already used a workbook.
Monitoring basics
When thinking about monitoring , we usually start with the tooling and work backwards which shouldn’t be the case , actually the tool to use should be the last step. Before selecting or touching the monitoring tool we need to first think about the following :
- What do i need to monitor (application , service , behavior ,…etc)?
- What are the metrics , KPIs and threshholds (CPU utilization , Idle resources , uptime of application , ….etc)
- Where do i get the data? (Azure Monitor metrics , log analytics , custom API , azure resource graph , …..etc)
- How to visualize it ? (bar charts , text , graph ,….etc)
- Choose the right solution ⬅️ Choosing the tool should be the last step in your monitoring strategy
Assuming you have already decided on the above steps , let’s focus on exploring the capabilities of the tool “Azure Monitor Workbook”.
Data Sources
What’s so cool about workbooks is that it gives you great flexibility to get the data you need using one or more data sources , so you can query log analytics , metrics , azure resource graph , a custom API endpoint or even mix between those sources. See Azure Monitor workbook sources for the latest available sources.
- Logs
- Metrics
- Azure Resource Graph
- Azure Resource Manager
- Azure Data Explorer
- Workload health
- Azure resource health
- Change Analysis (preview)
- Merge data from different sources
- JSON
- Alerts (preview)
- Custom endpoint
💡 Imagine a scenario where you need an interactive view that can change based on your input and can pull infromation from multiple sources and even merge them.
In future posts , i will demonstrate creating some interesting workbooks to show how to use the different sources.
Visualization
Being able to query various resources is a neat capability but to make it really cool and useful is how this information is visualized and here comes the power of workbooks where you have full flexibility to select and customize different interactive visualizations which you can drill in to get more information or click to get more context.
Parameters
Finally , parameters is a great way to filter your queries and visualizations to make your workbooks resuable by different teams. Some would like to view information based on their subscription , resource group , tags or any other filter that makes sense to them.
Building a Workbook
Let’s now give Workbooks a spin by creating a workbook that will show the following information :
- Add text to describe the purpose of this workbook
- View all resources locations - Using Azure Resource Graph
- View CPU utilization for all Virtual machines - Using Azure Monitor Metrics
- Get vCPU cores limit for our subscription - Using Azure Resource Manager
- Resources Health - Using Azure Health
- Missing updates on Virutal machines - Using Log Aanalytics
- The temperature for the next 3 days (cause why not 😄) - Using custom endpoint
💡 The custom endpoint source can be very useful if you have other services that are exposed via APIs and you would like to bring this data into your workbook and merge it with other sources.
First we add some useful text to explain what data we are showing in our workbook.
Next , we add a new query to summarize all resources by location and put it on map , this can be helpful to quickly identify if we are not doing a good job governing our environment and someone created a resource in an unapproved location.
Next , we will add a new metric query to show the CPU utilization of our VMs.
We will need to add some parameters to make the workbook reusable and interactive , so i will add one for subscription and one for location.
Next , we will query the azure resource manager API to get the vCPU limits against our subscription and location (will be provided by the parameters we created in the previous step).
Next , we will query Azure resource health to have a quick glance on the health of our Azure resources
Next , we will query log analytics to get updates compliance on our virtual machines and will change some of the visualizations to add colors to show severity.
Finally , to demonstrate the capabilities of Azure Workbooks , i will query a public weather API endpoint to get the weather forecast for the next 3 days 🌦️
Recap
Workbooks are extremely helpful , powerful and flexible , it allows you to create interactive views of anything you would like to monitor in Azure and even outside (if it has an API endpoint).
This post is just scratching the surface , in future posts i will go a little bit deeper to showcase more advanced scenarios that really makes Workbooks standout in your monitoring toolset.

My name is
Seif Bassem
You May Also Like

Continuous delivery to Azure using Bicep and GitHub actions
Infrastructure-as-code with Bicep and GitHub actions Bicep has been a …
Building and hosting this blog using Azure Static Web Apps
Starting a blog 📖 I have been thinking a lot lately about having my …
Project servers to Azure from virtually anywhere!!
Going multi-cloud or hybrid 🚀, missing anything?! The rapid increase …